

Candlesticks
What are candlesticks? Japanese candlesticks are a type of chart used to visualize the price action of stocks (or any other financial instrument). They are called Japanese candlesticks because they were first used by Japanese traders in the 18th century to analyze the price of rice futures.
A Japanese candlestick consists of a rectangular body (called the "real body") with a line (called the "wick" or "shadow") on either end. The body represents the difference between the opening and closing prices of the stock during a given period, while the wicks show the range of prices that the stock traded within during that period.
The color of the body is determined by whether the stock closed higher or lower than its opening price. If the stock closed higher, the body is typically colored green or white. If the stock closed lower, the body is typically colored red or black.
Japanese candlesticks can provide a lot of information about the price action of a stock, including its opening and closing prices, the high and low prices it traded at during a given period, and whether the bulls or the bears were in control during that period.
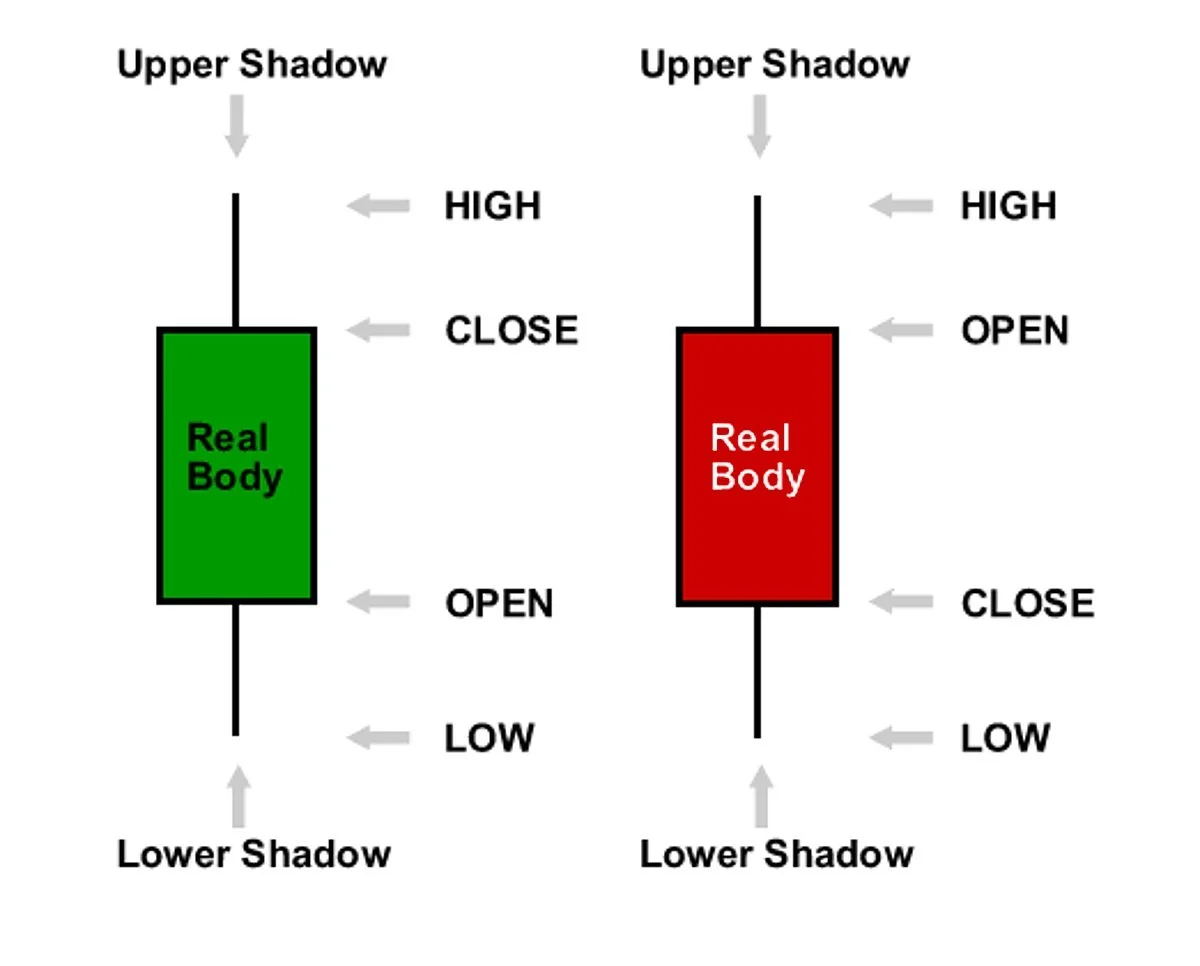
Bullish Candle
-
The upper wick (also known as the upper shadow) is the thin line that extends from the top of the body to the highest price reached during the time period. It represents the highest price that the stock traded at during that time period.
-
This is the highest price that the stock reached during the time period represented by the candlestick. It's represented by the top of the upper wick.
-
This is the price at which the stock finished trading at the end of the time period that the candlestick represents.
-
This is the price at which the stock started trading at the beginning of the time period that the candlestick represents.
-
This is the lowest price that the stock reached during the time period represented by the candlestick. It's represented by the bottom of the lower wick.
-
The lower wick (also known as the lower shadow) is the thin line that extends from the bottom of the body to the lowest price reached during the time period. It represents the lowest price that the stock traded at during that time period.
Bearish Candle
-
The upper wick (also known as the upper shadow) is the thin line that extends from the top of the body to the highest price reached during the time period. It represents the highest price that the stock traded at during that time period.
-
This is the highest price that the stock reached during the time period represented by the candlestick. It's represented by the top of the upper wick.
-
This is the price at which the stock started trading at the beginning of the time period that the candlestick represents.
-
This is the price at which the stock finished trading at the end of the time period that the candlestick represents.
-
This is the lowest price that the stock reached during the time period represented by the candlestick. It's represented by the bottom of the lower wick.
-
The lower wick (also known as the lower shadow) is the thin line that extends from the bottom of the body to the lowest price reached during the time period. It represents the lowest price that the stock traded at during that time period.
Candlestick patterns can be created using single, double, or triple candlesticks. A single candlestick pattern is formed by a single candlestick, while double candlestick patterns require two candlesticks, and triple candlestick patterns involve three candlesticks. These patterns are easy to recognize, and when combined with other technical analysis tools like Support and Resistance, Trend Lines, or Fibonacci Retracement levels, they can help you identify potential trading opportunities in the market.
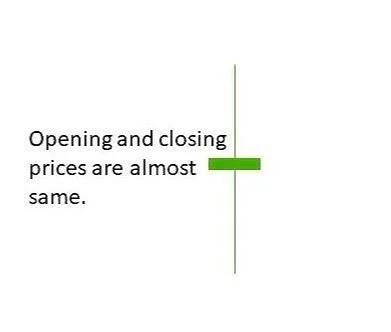
The opening price and closing price of a security are almost equal. In other words, the Doji has a very small or nonexistent body, and upper and lower wicks of similar length. The Doji candlestick pattern suggests indecision and a potential reversal of the current trend. The length of the upper and lower wicks in relation to the size of the body can provide further clues about the strength of the potential reversal. A long upper wick suggests that buyers pushed the price up during the trading session, but the selling pressure eventually outweighed the buying pressure, resulting in the price closing near the opening price and visa versa.
DOJI
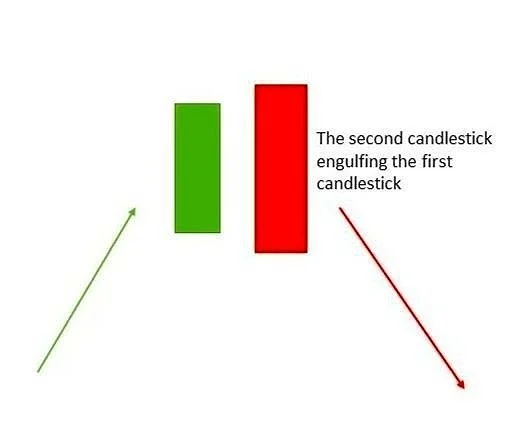
Double candlestick pattern that occurs at the end of an uptrend. The first candlestick in the pattern is a bullish candlestick with a large body, followed by a bearish candlestick with an even larger body that engulfs the body of the previous bullish candlestick. The Bearish Engulfing pattern suggests that the buyers were in control during the first candlestick, but the sellers entered the market during the second candlestick and overwhelmed the buyers, resulting in a potential reversal of the uptrend.
BEARISH ENGULFING
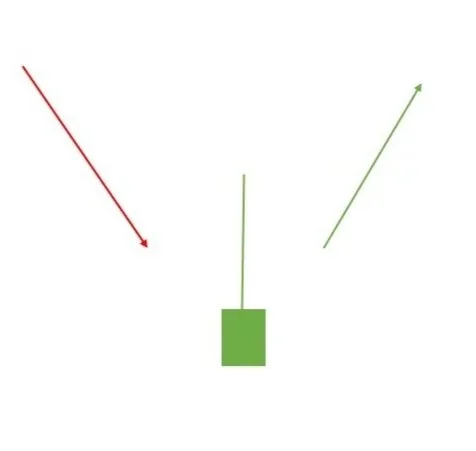
HAMMER
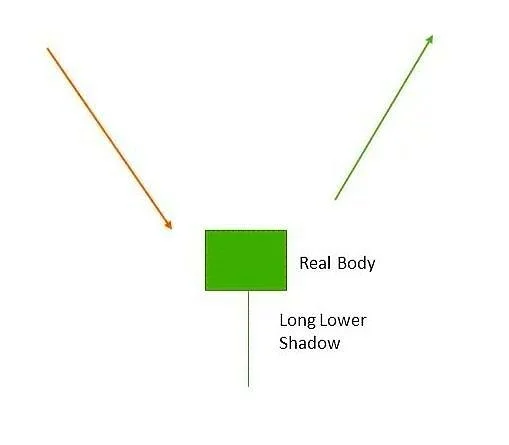
Candlestick pattern that occurs at the end of a downtrend. It has a small body located near the top of the candlestick and a long lower wick, resembling a hammer. The Hammer pattern suggests that buyers entered the market during the trading session and pushed the price up, but the selling pressure eventually outweighed the buying pressure, resulting in the price closing near the opening price. However, the long lower wick indicates that buyers were able to drive the price back up near the opening price, suggesting a potential reversal of the downtrend.

Three-candlestick pattern that occurs at the end of a downtrend. The first candlestick in the pattern is a bearish candlestick with a large body. The second candlestick is a small-bodied candlestick that may be bullish or bearish and gaps down from the previous candlestick. The third candlestick is a bullish candlestick with a large body that engulfs the body of the previous candlestick. The Morning Star pattern suggests that the sellers were in control during the first candlestick, but the buyers entered the market during the second candlestick and pushed the price up, and this buying momentum continued during the third candlestick. This pattern is a strong indication of a potential reversal of the downtrend.
MORNING STAR
INVERTEDHAMMER
Single candlestick pattern that occurs at the end of an uptrend. It has a small body located near the bottom of the candlestick and a long upper wick, resembling an inverted hammer. The Inverted Hammer pattern suggests that sellers entered the market during the trading session and pushed the price down, but the buying pressure eventually outweighed the selling pressure, resulting in the price closing near the opening price. However, the long upper wick indicates that buyers were able to drive the price back up near the opening price, suggesting a potential reversal of the uptrend.
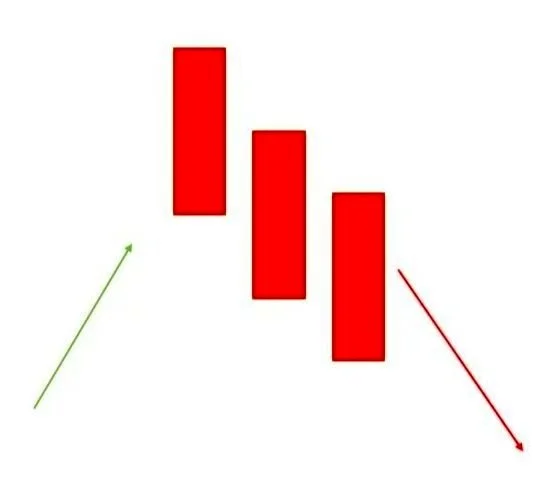
Three Black Crows candlestick pattern is a bearish reversal pattern consisting of three consecutive long-bodied bearish candlesticks. Each candlestick in the pattern opens within the real body of the previous candlestick and closes near its low. The pattern suggests that the sellers are firmly in control and are pushing the price down. It is usually formed after a strong uptrend and indicates a potential reversal of the trend. Traders often look for confirmation from other technical indicators or price action
THREE BLACK CROWS

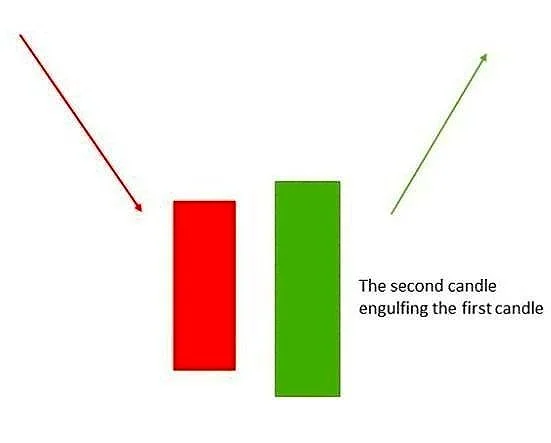
Double candlestick pattern that occurs at the end of a downtrend. The first candlestick in the pattern is a bearish candlestick with a large body, followed by a bullish candlestick with an even larger body that engulfs the body of the previous bearish candlestick. The Bullish Engulfing pattern suggests that the sellers were in control during the first candlestick, but the buyers entered the market during the second candlestick and overwhelmed the sellers, resulting in a potential reversal of the downtrend.
BULLISH ENGULFING
Three White Soldiers is a bullish candlestick pattern that occurs in a downtrend, indicating a potential reversal of the trend. The pattern is formed by three consecutive long-bodied bullish candlesticks that open within the real body of the previous candlestick and close near the high of the day. The first candlestick opens lower than the previous day's close and closes higher than the previous day's open. The second candlestick also opens lower than the previous day's close but closes higher than the first candlestick's close and has a higher high. The third candlestick opens lower than the second candlestick's close but closes near the high of the day. The pattern suggests that buyers have taken control of the market
THREE WHITE SOLDIERS
PACKAGES FOR ALL LEVELS OF DAY TRADERS
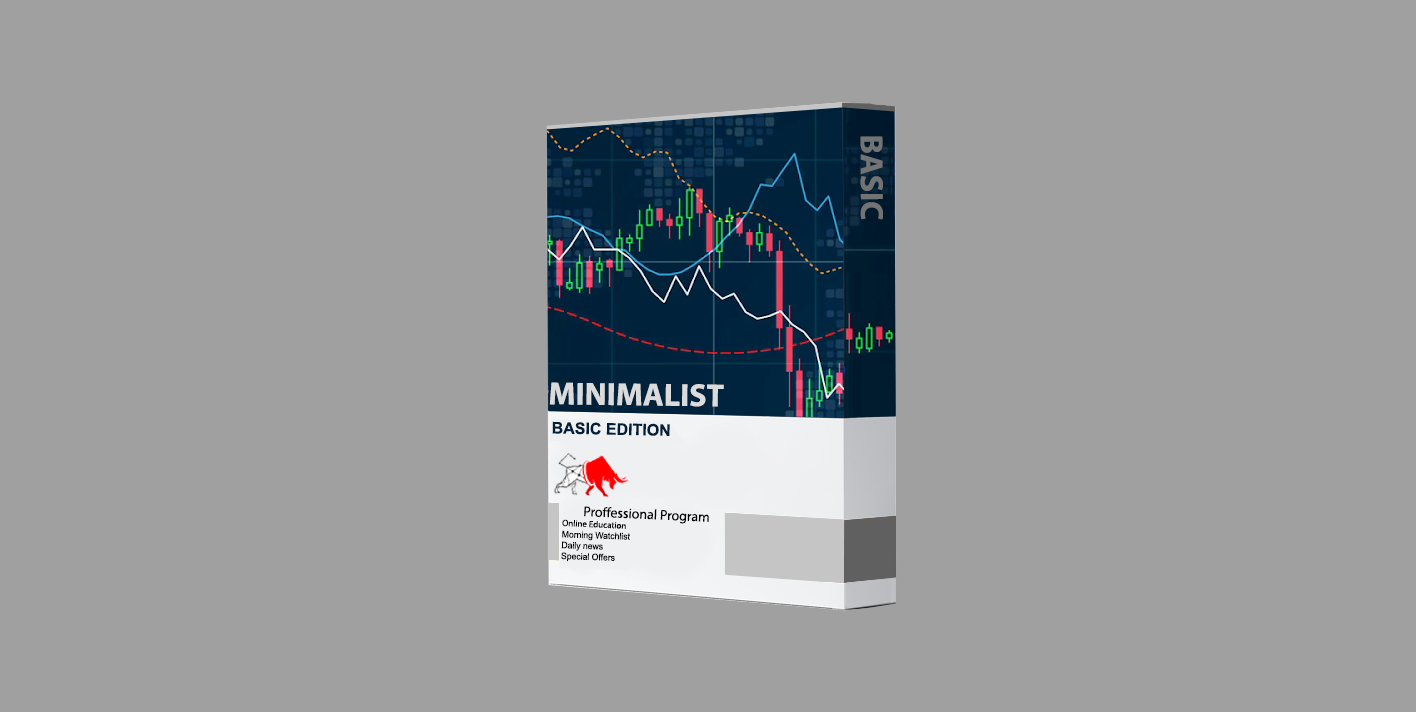
BASIC
-
You can learn the fundamentals of day trading stocks, understand technical analysis and charting, and learn how to implement successful trading strategies.
-
With our morning watchlist service, you will receive an expertly curated list of stocks each morning before the market opens. Our team of experienced traders and analysts scour the market for the best trading opportunities, and provide you with a comprehensive list of stocks to watch.
-
We scour the markets to bring you the latest news and insights on stocks. you can stay on top of earnings reports, product launches, regulatory changes, and other market-moving events. Our content is delivered through our website and email newsletters making it easy for you to access the information you need, wherever you are.
-
we are always looking for ways to provide more value to our subscribers. we are constantly offering special discounts on both our standard and pro packages. Whether you are a new customer or an existing subscriber, you can take advantage of these special offers and save on your subscription fees.

-
In this package, we include all of the services that are in the basic package, as well as additional features such as personalized coaching, advanced market analysis tools, detailed strategy breakdowns and so much more.
-
An integrated education service that is specifically designed to help traders learn the skills and strategies needed to succeed in day trading stocks. Our education service includes detailed lessons on technical analysis, fundamental analysis, market psychology, risk management, and much more.
-
we offer a specialized service that provides market analysis for day trading stocks. We analyze the various factors that influence the prices of stocks in the market. It involves examining technical indicators, fundamental data, and market sentiment to identify trading opportunities and make informed decisions.
-
Our strategy breakdowns provide detailed analysis of various trading strategies and techniques, including technical analysis, fundamental analysis, and trend following. We break down each strategy into easy-to-understand steps, and provide examples of how to apply them to real-world trading scenarios. Our strategy breakdowns are included in both our standard and pro packages.
-
Our technical analysis is included in both our standard and pro packages, Our technical analysis includes advanced charting tools, indicators, and market data to help you identify trends, support and resistance levels and covers a wide range of technical indicators, including moving averages, oscillators, and trend lines.
-
we offer comprehensive fundamental analysis in our packages to help our customers gain a deeper understanding of companies, industries, and market trends. Our fundamental analysis includes in-depth research on companies' financial statements, earnings reports, industry trends, and market performance.
STANDARD
PROFESSIONAL
-
we understand that serious traders and investors require more than just basic market news and analysis to make informed investment decisions. That's why we offer a comprehensive Pro package that includes both our Basic and Standard packages, as well as additional features and tools designed to help you succeed in the stock market.
-
With our Pro package, you'll get all the benefits of our Basic and Standard packages. Gain access to our online education platform, which includes a range of courses, webinars, and tutorials covering topics such as technical analysis, risk management, trading psychology, and more.
-
you will receive our Daily News & Morning Watchlist delivered straight to you each morning. Our experienced team of analysts scours the markets to bring you a concise summary of the day's top news and developments, as well as a curated list of stocks to watch based on our research and analysis.
-
In-depth analysis of the stock market that covers a wide range of markets, including ETFs. We cover all stocks, including blue-chip companies, emerging market stocks, and small-cap stocks, to provide our clients with a comprehensive view of the market.
-
Our strategy breakdowns provide detailed analysis of various trading strategies and techniques, including technical analysis, fundamental analysis, and trend following. We break down each strategy into easy-to-understand steps, and provide examples of how to apply them to real-world trading scenarios. Our strategy breakdowns are included in both our standard and pro packages.
-
trading and investing in the stock market is as much about psychology as it is about numbers and data. Our Market & Behavioral Psychology feature combines insights from both market analysis and psychology to provide a comprehensive understanding of how emotions and human behavior can impact the stock market. We analyze investor sentiment, market trends, and other behavioral factors that can drive stock prices up or down.
-
Managing risk is a critical component of successful trading and investing in the stock market. We provide detailed risk analysis on individual stocks and market sectors, including volatility, historical performance, and other key risk factors that can impact a stock's performance. We also provide risk management strategies and techniques that traders and investors can use to mitigate their risk exposure, including diversification, position sizing, stop-loss orders, and other risk management tools.
-
We provide detailed technical analysis on individual stocks and market sectors, including price action, chart patterns, technical indicators, and other key technical factors that can impact a stock's performance. We also provide technical analysis strategies and techniques that traders and investors can use to identify potential entry and exit points, including trend analysis, support and resistance levels, and other technical signals. Our technical analysis feature is designed to help traders and investors develop a more comprehensive view of the market and make more informed trading decisions.
-
Our fundamental analysis feature includes a variety of tools and resources to help traders and investors analyze a company's financial health and identify potential trading opportunities. We provide detailed fundamental analysis on individual stocks and market sectors, including financial statements, earnings reports, valuations, and other key financial factors that can impact a stock's performance.