My 2025 Performance
This is what my year has looked like so far.
Every dot, every dip, every climb on this chart. it’s all from live trading days. I trade 3–5 days a week, and I track everything. The wins, the losses, the mistakes, and the growth.
I’m not here to show “perfect” results. I’m here to show real progress.
My win rate this year has stayed around 60–65%, and my total P&L sits at $89,546 as of October.
Wins&Loss Ratio

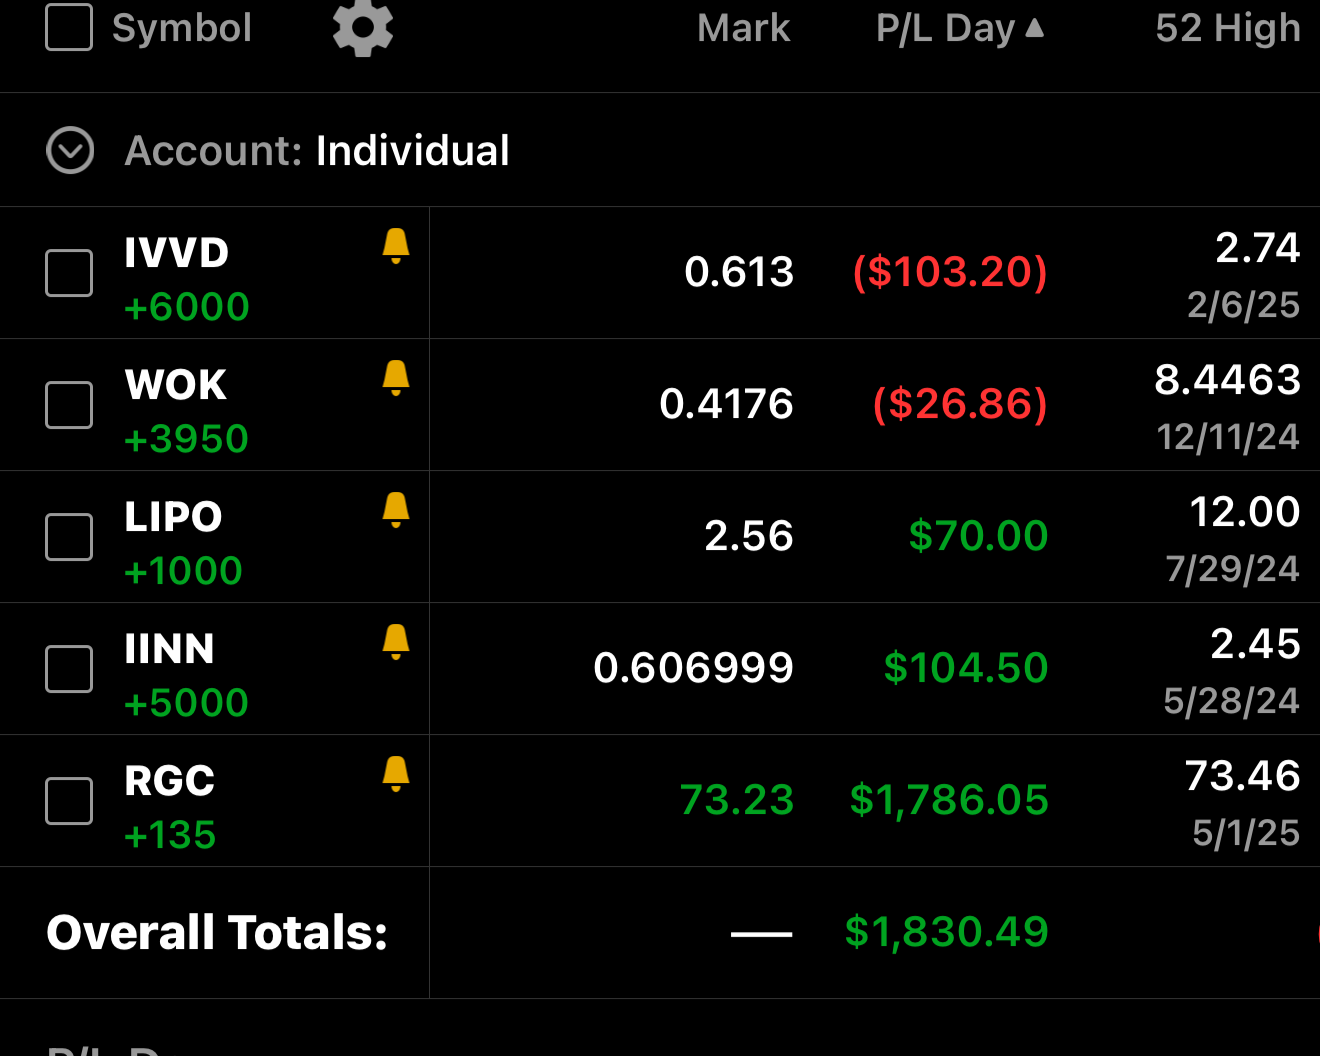
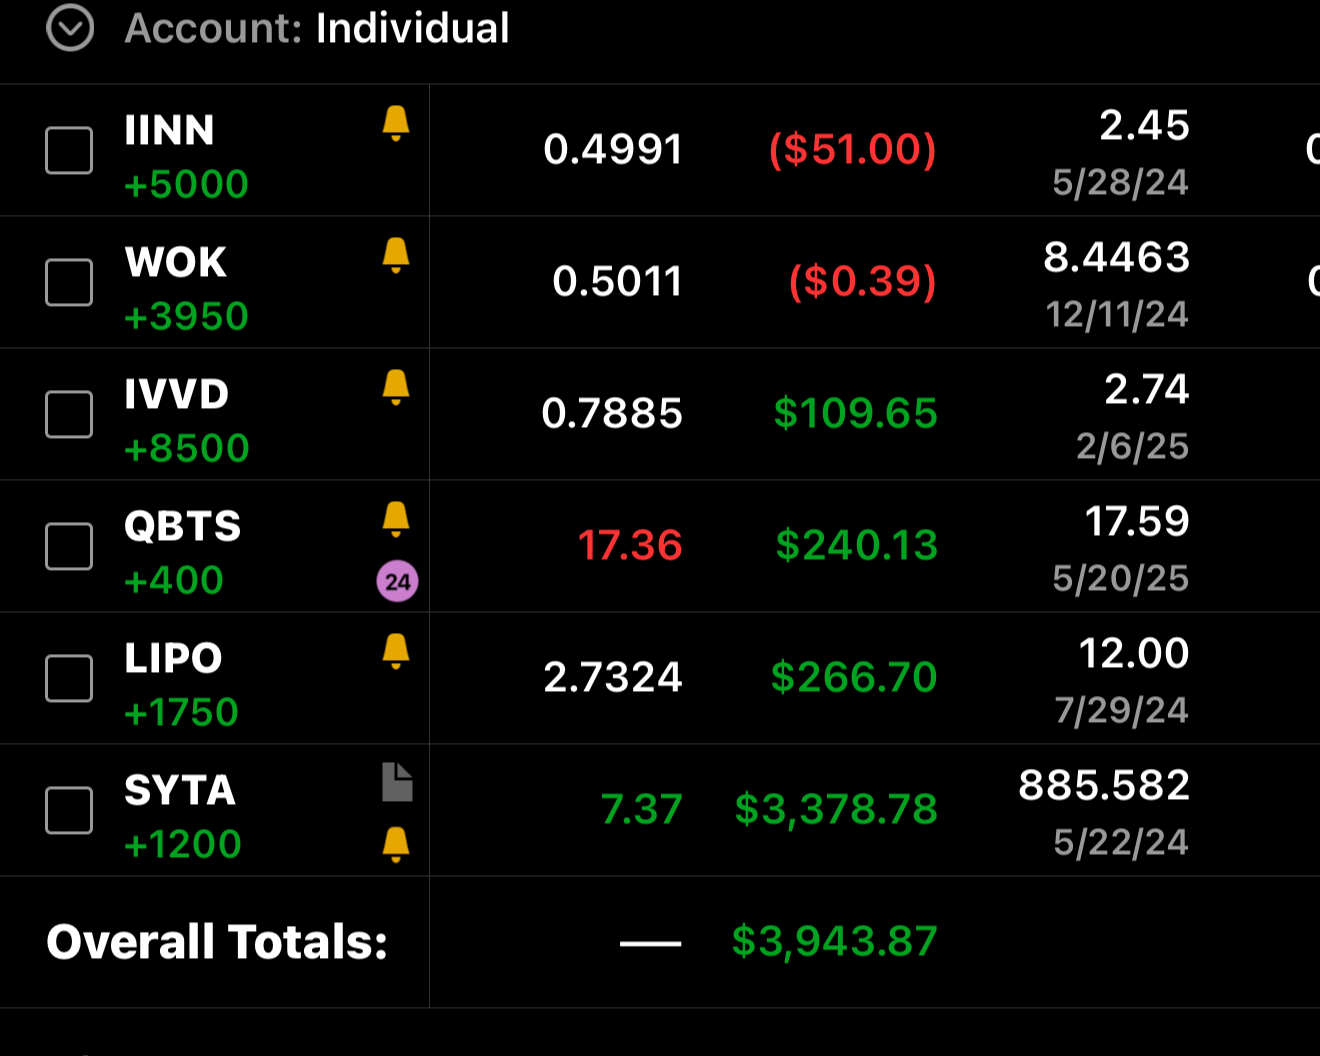
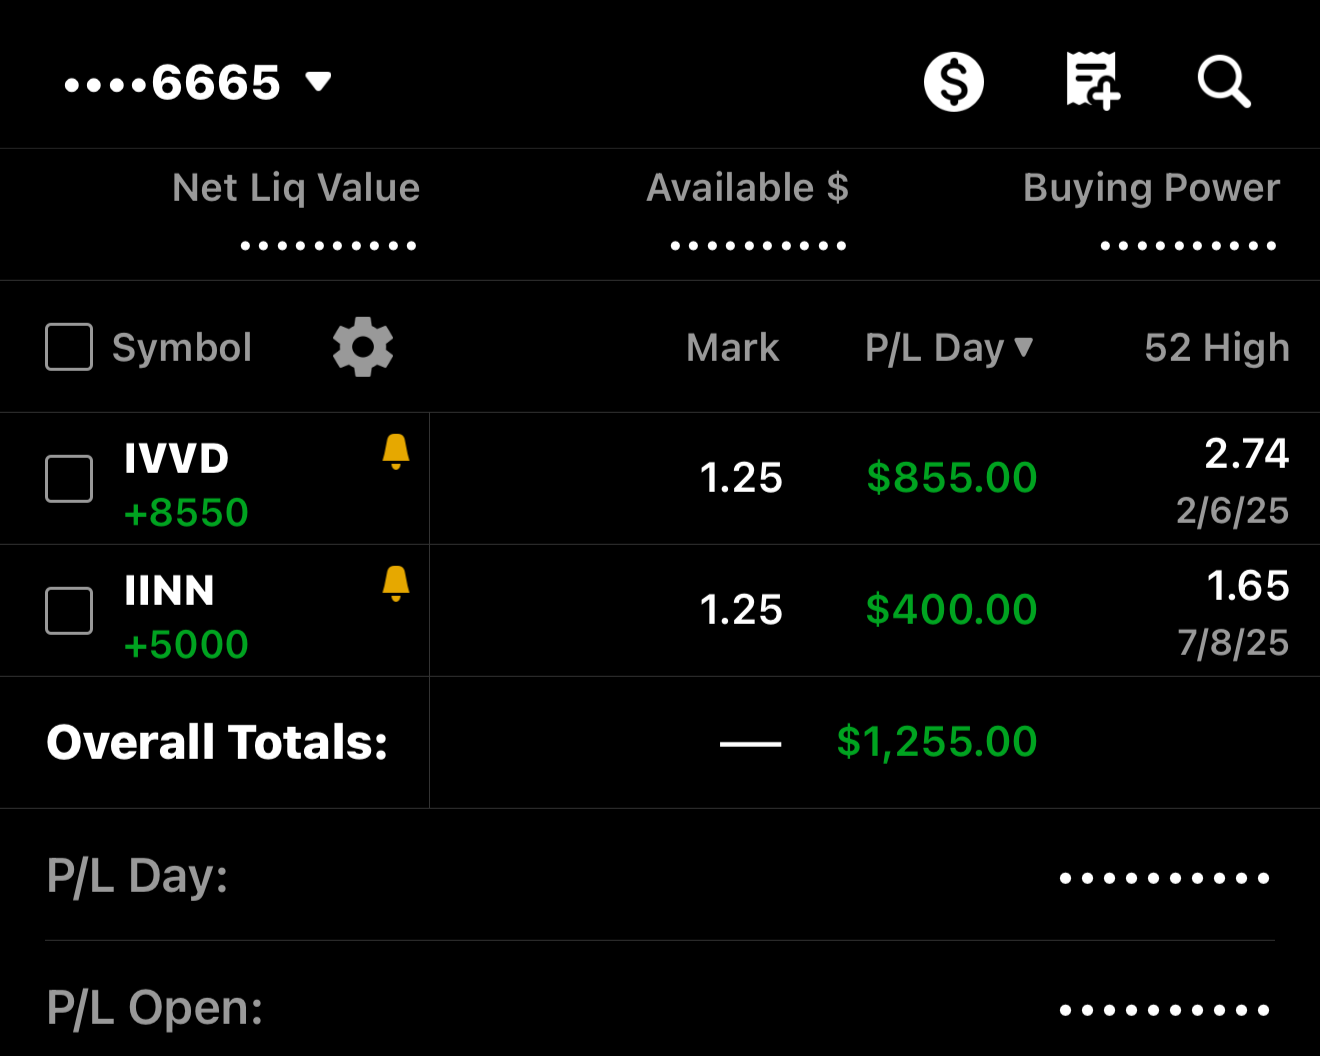
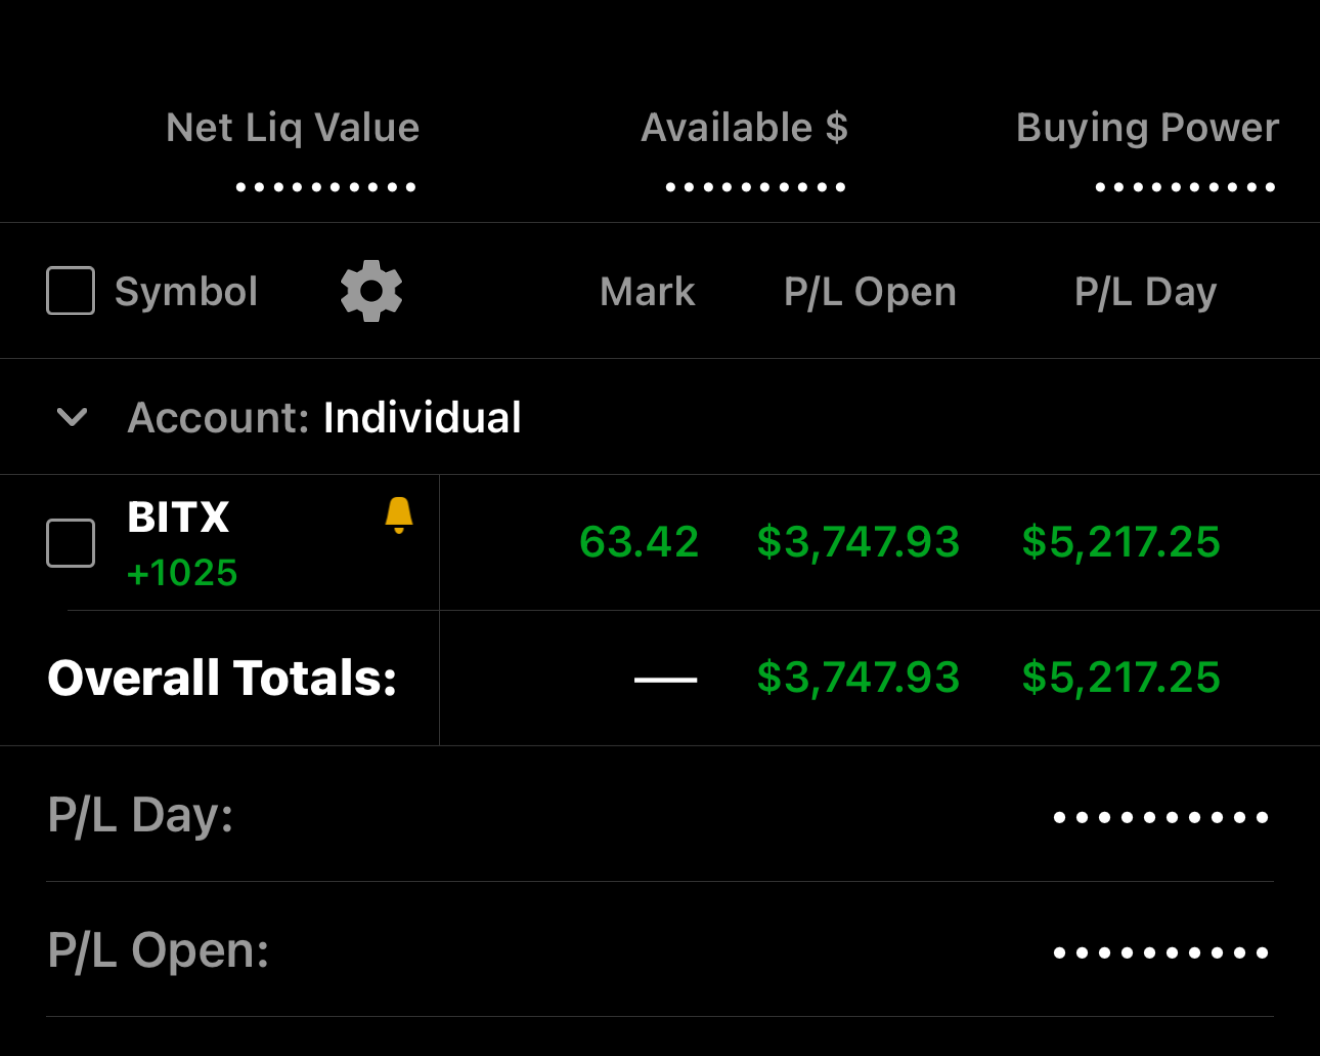
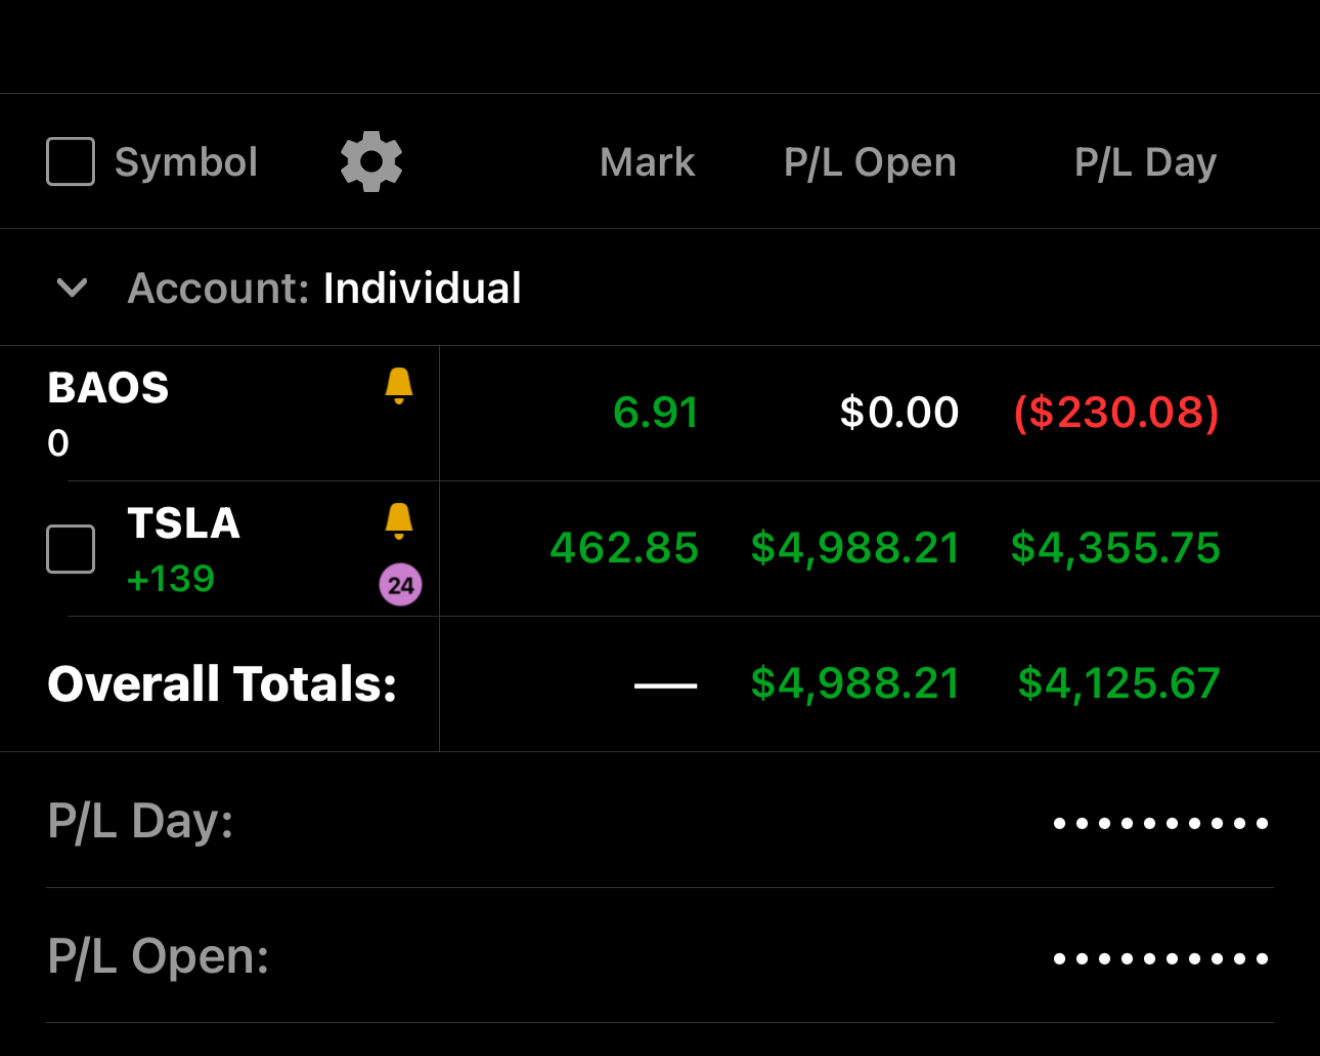
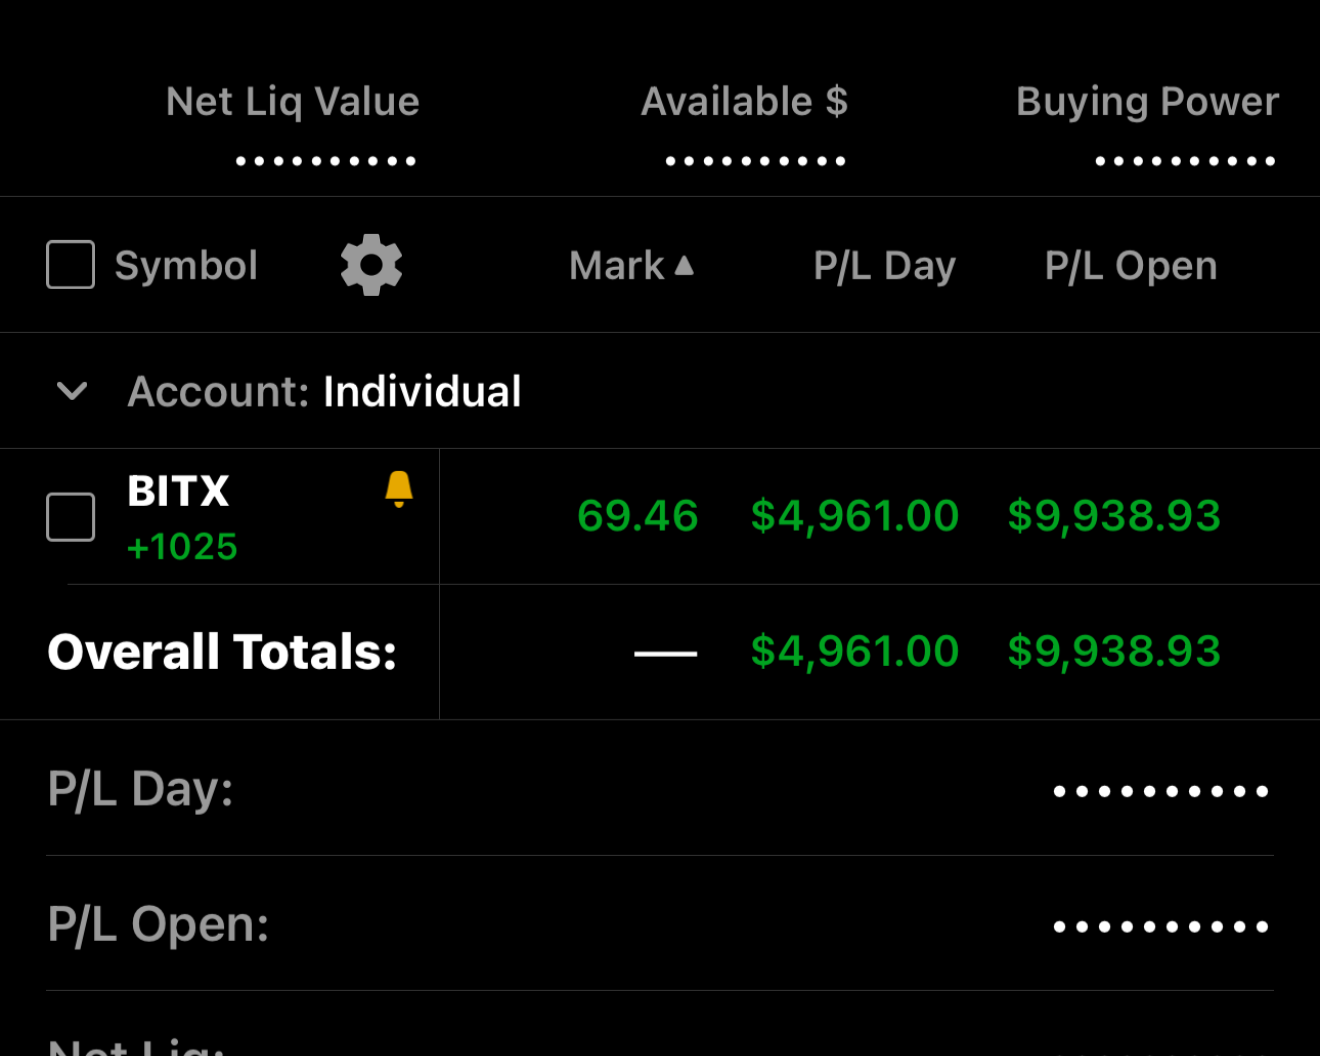
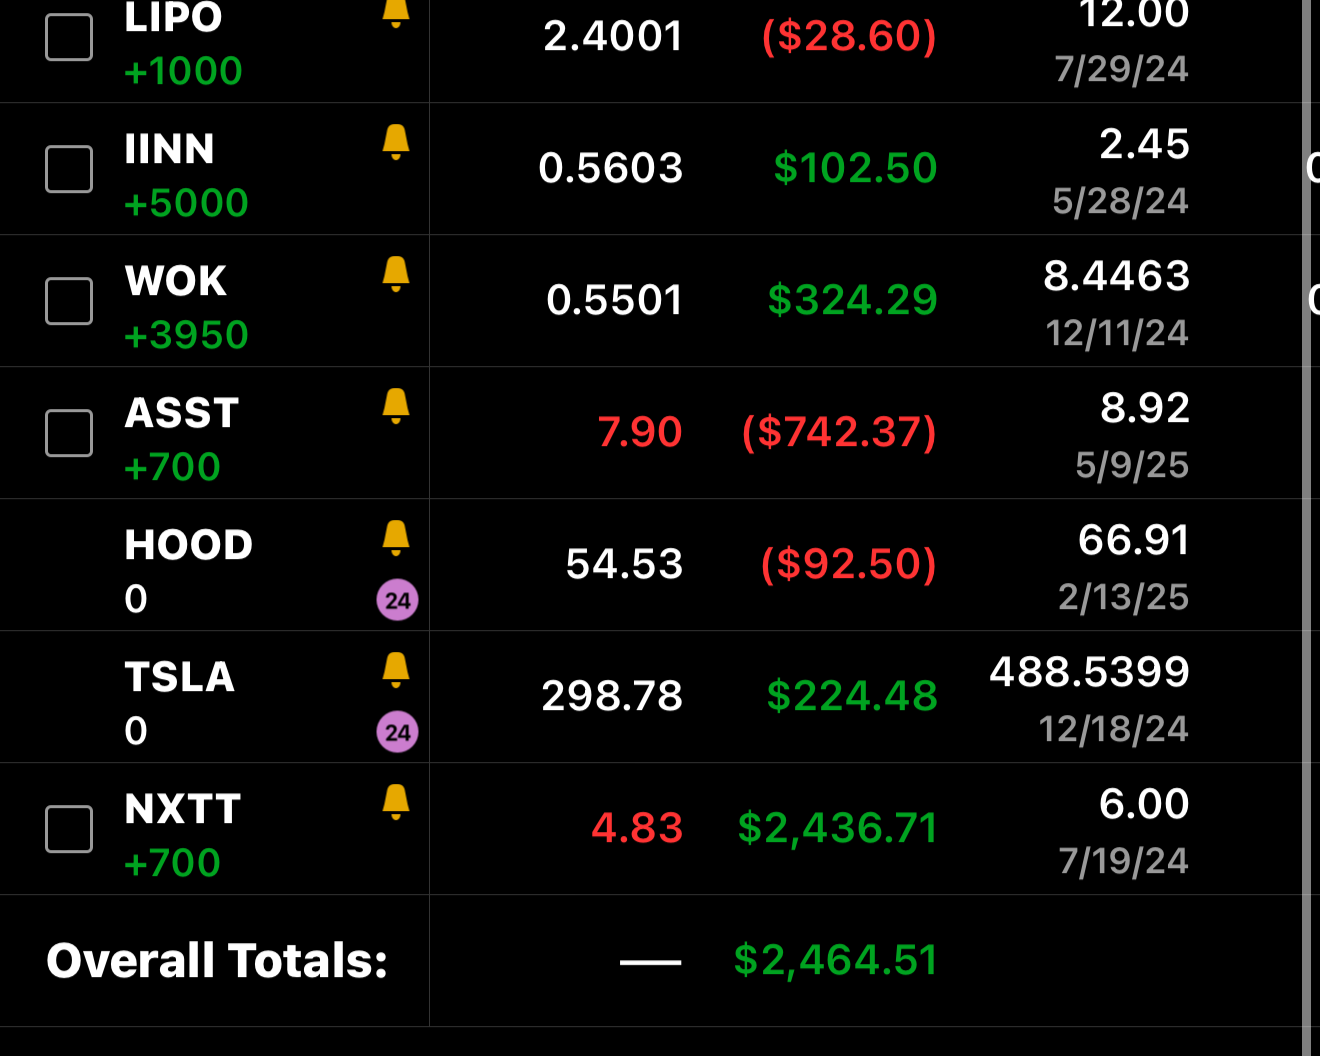
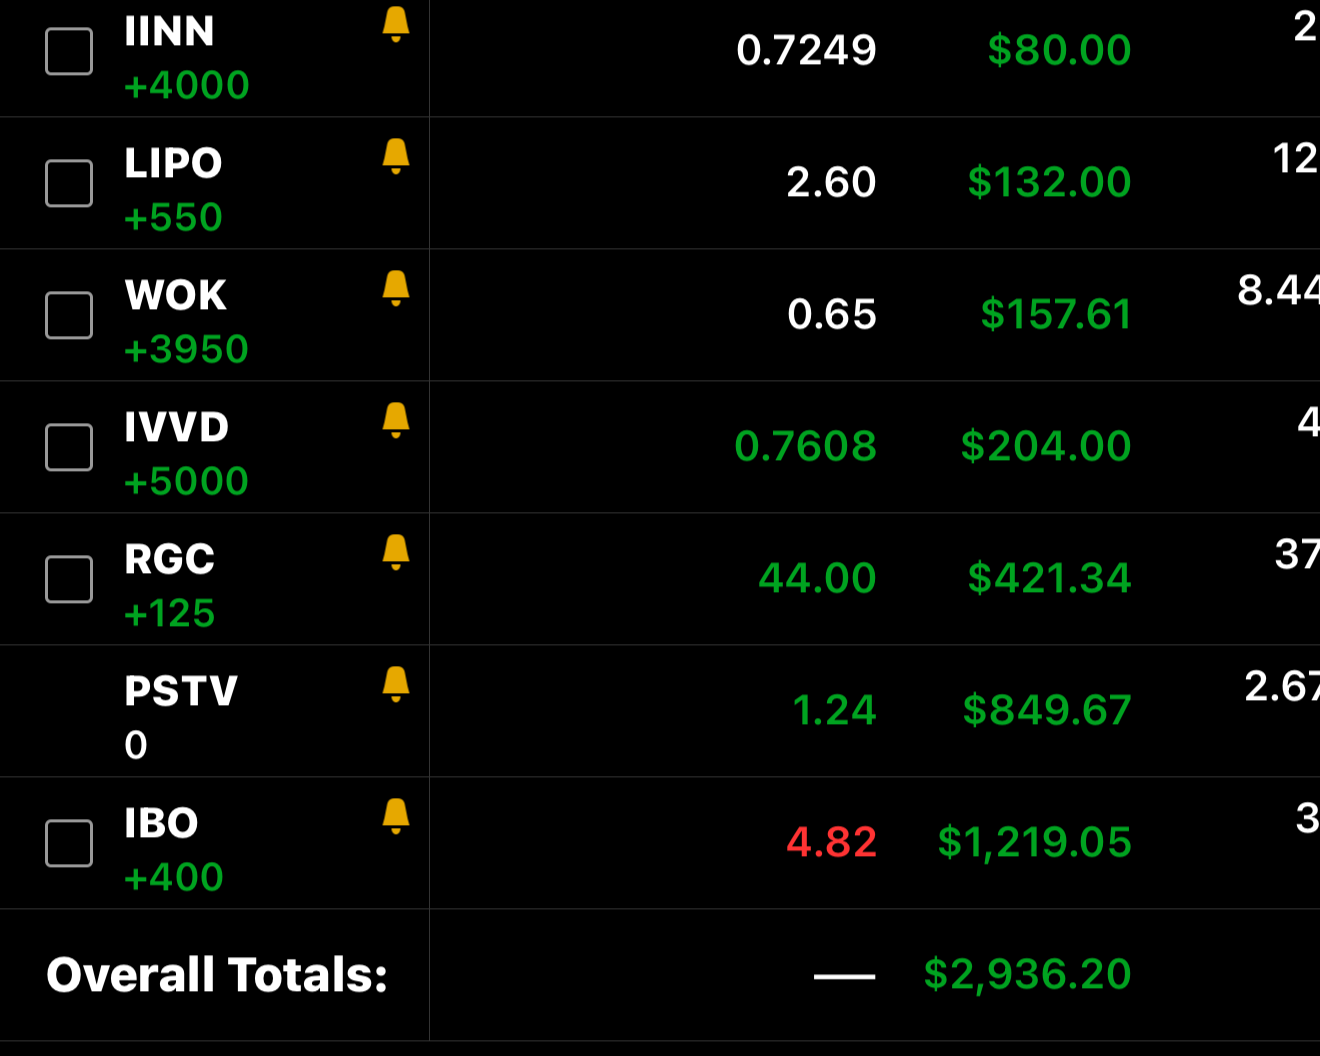
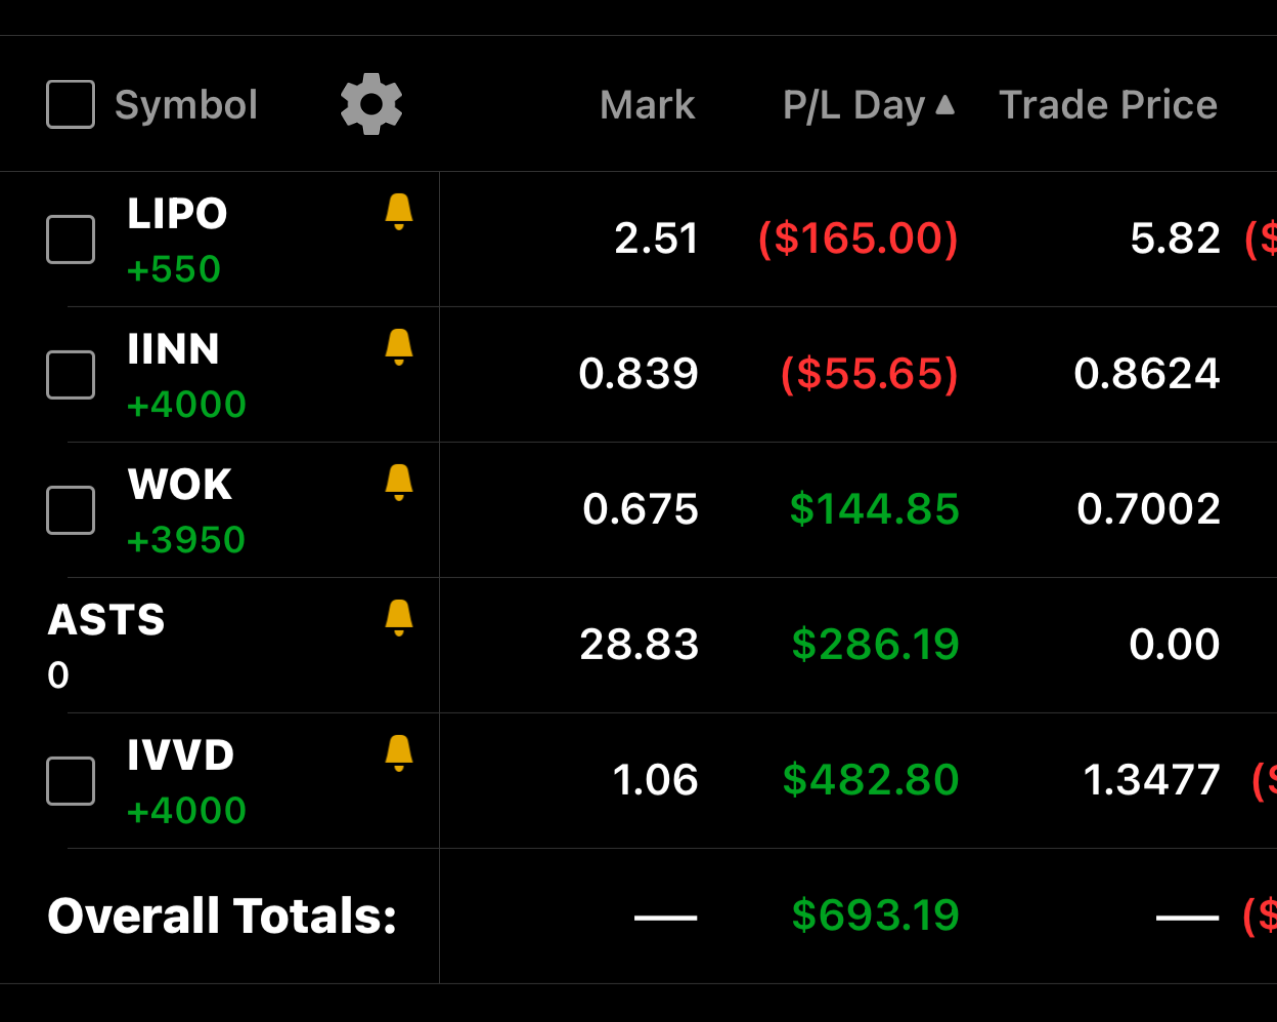
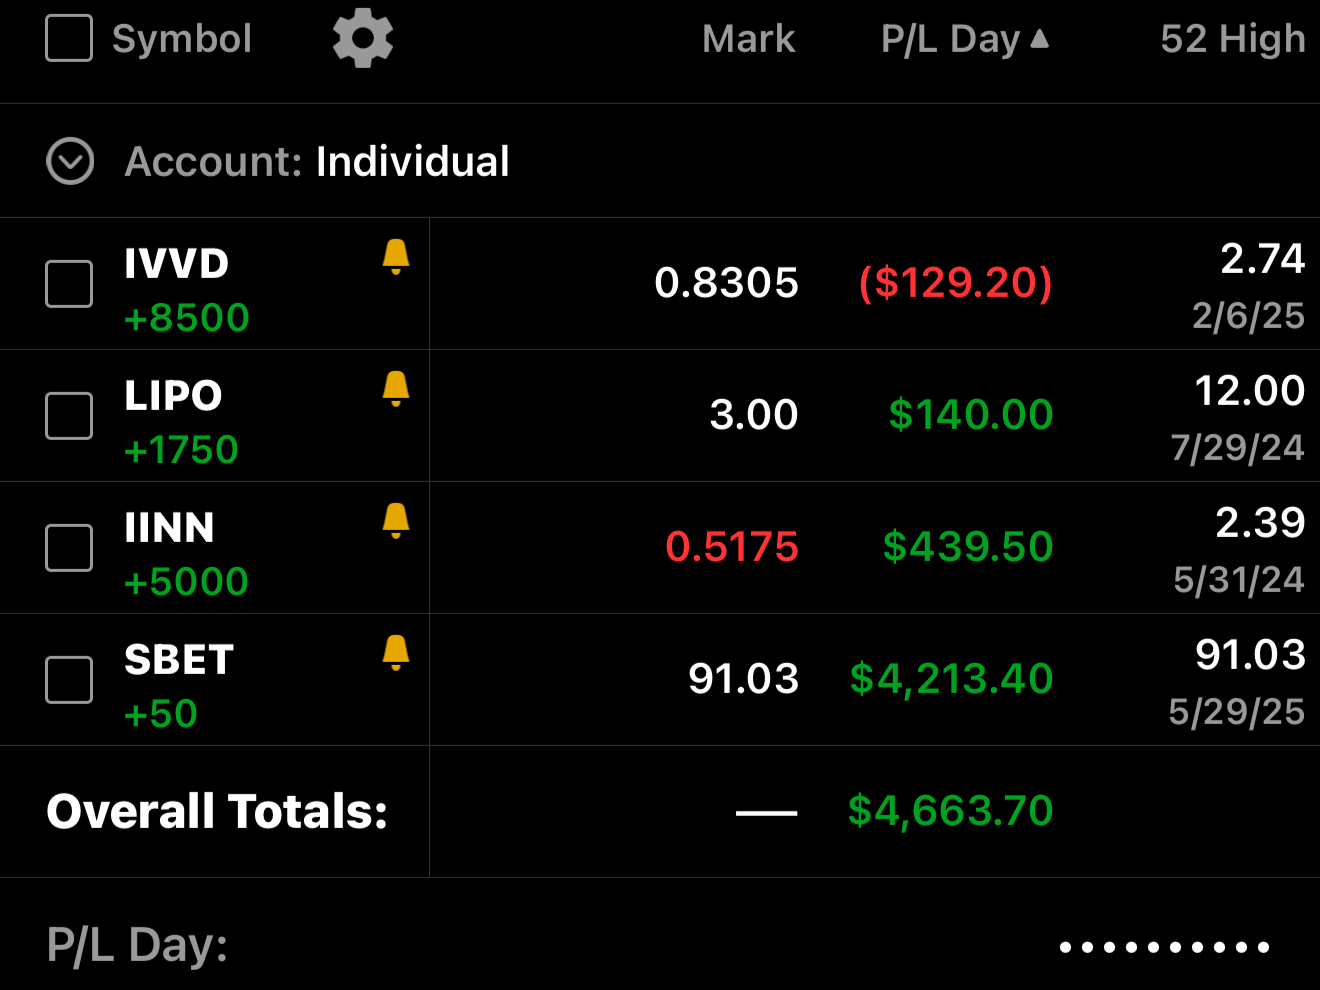
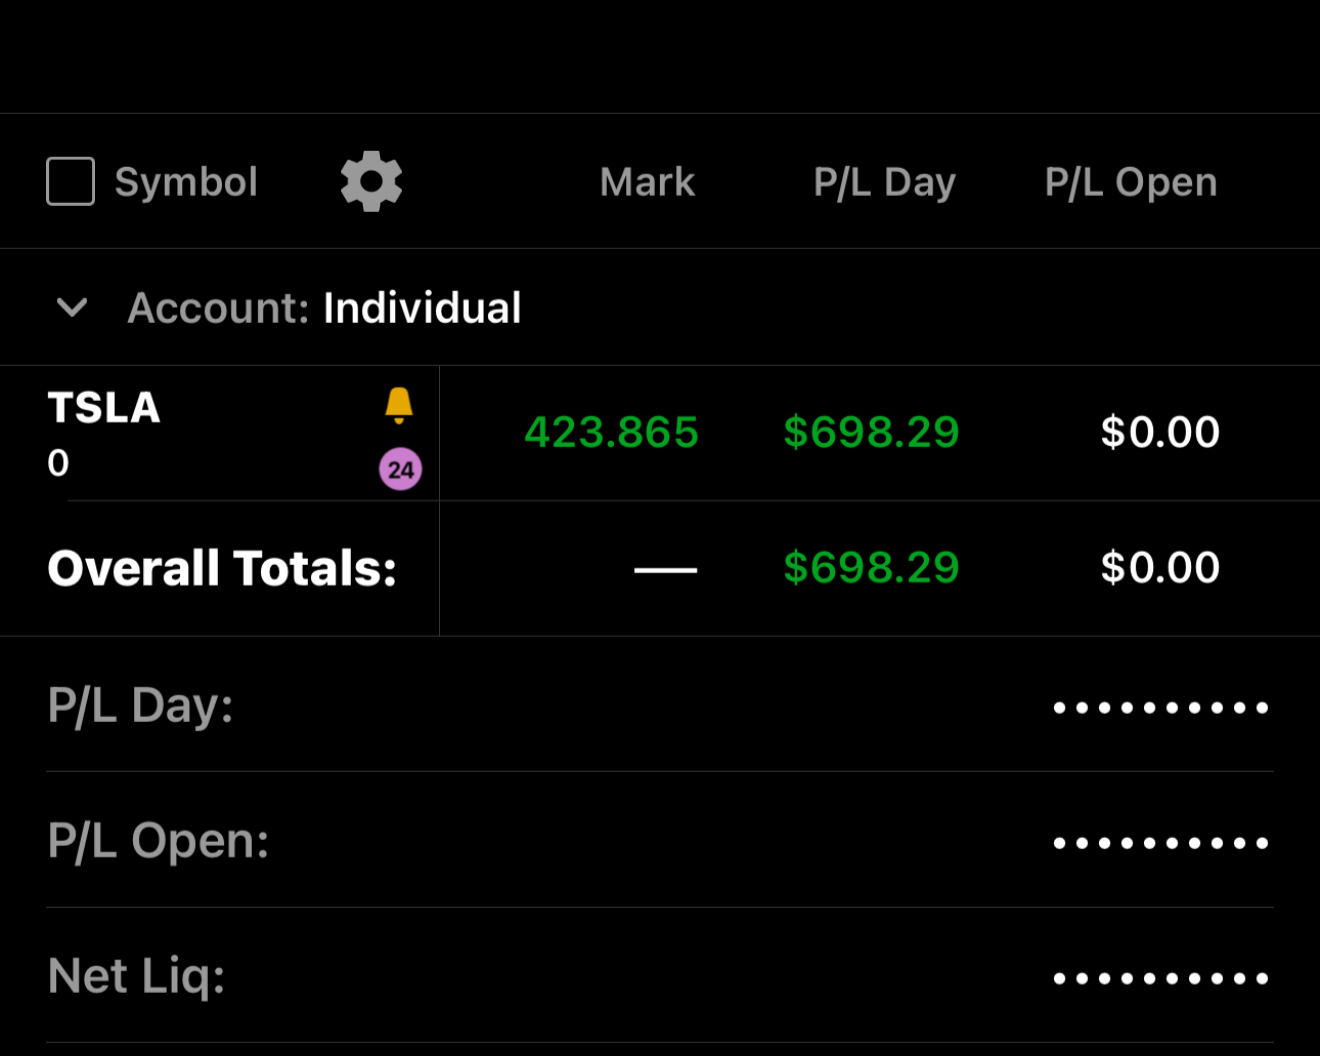
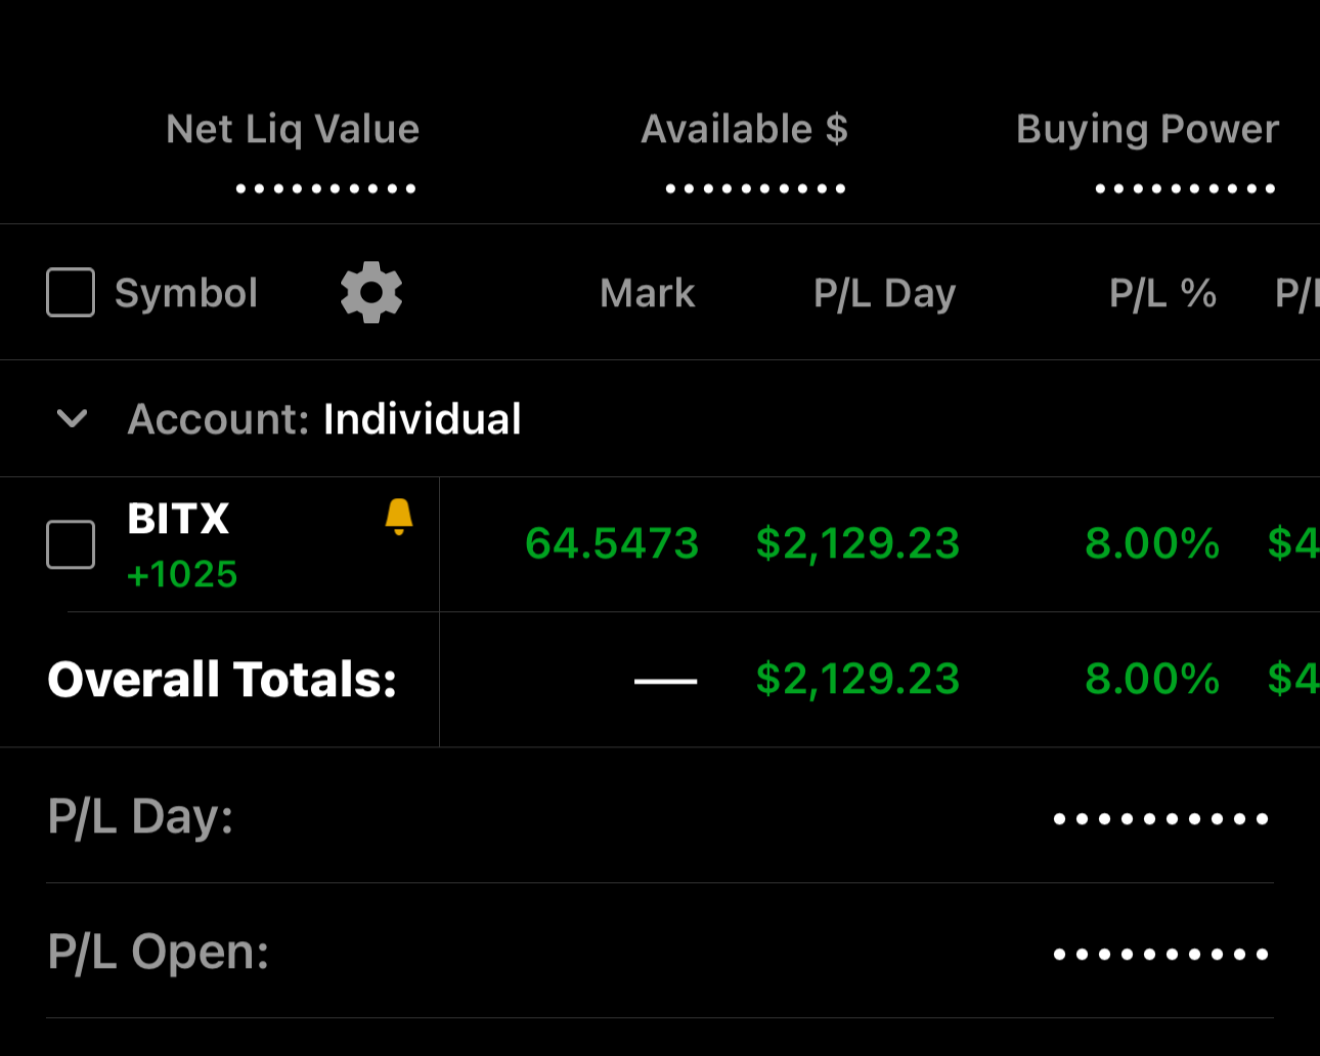
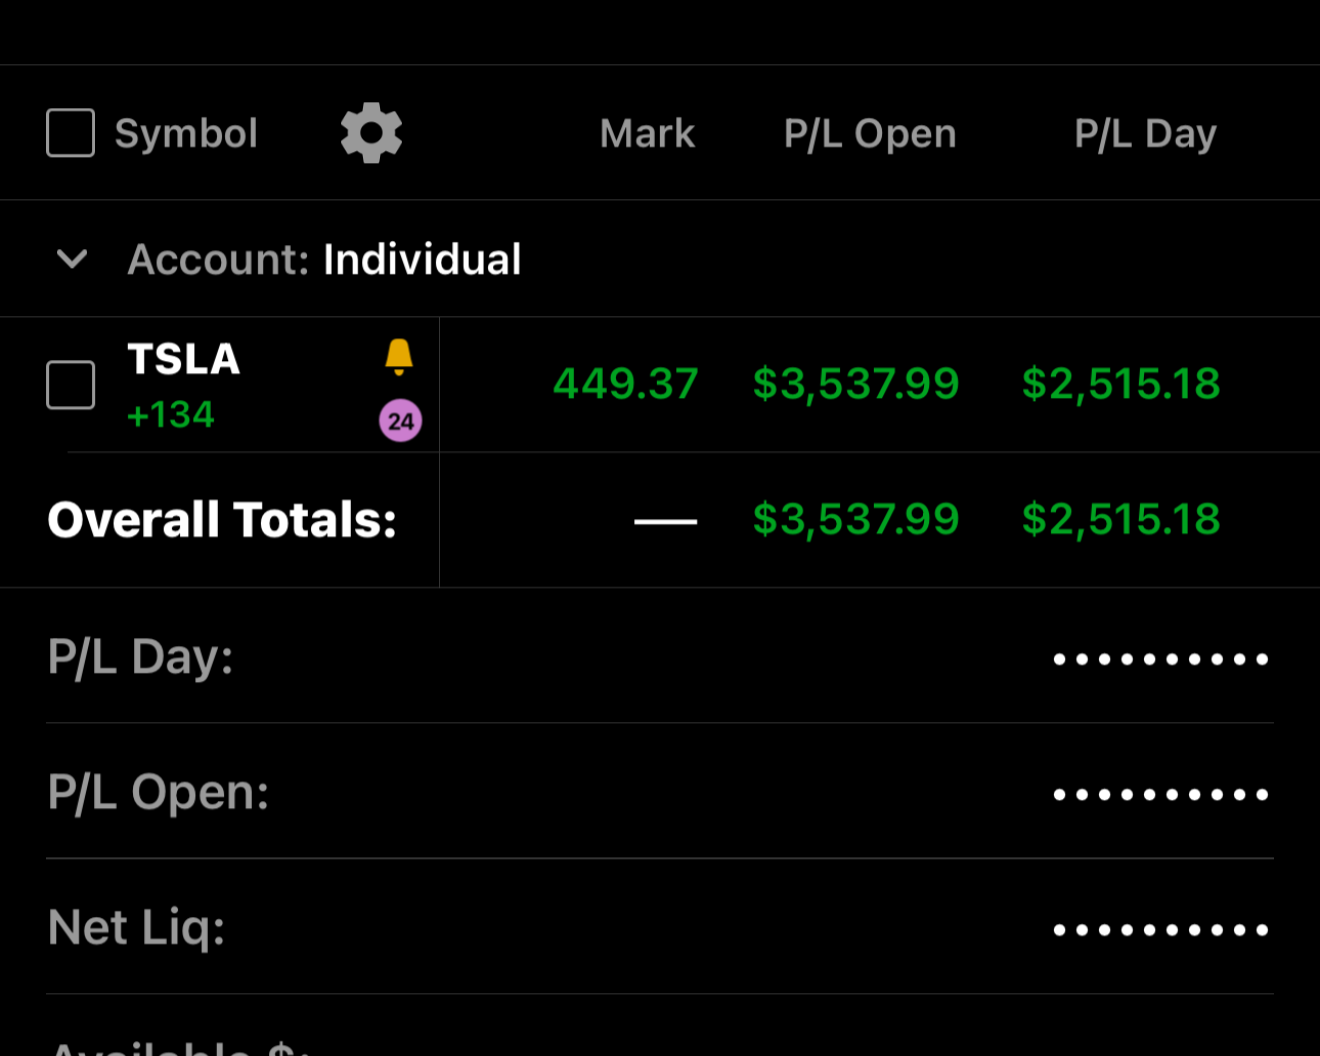
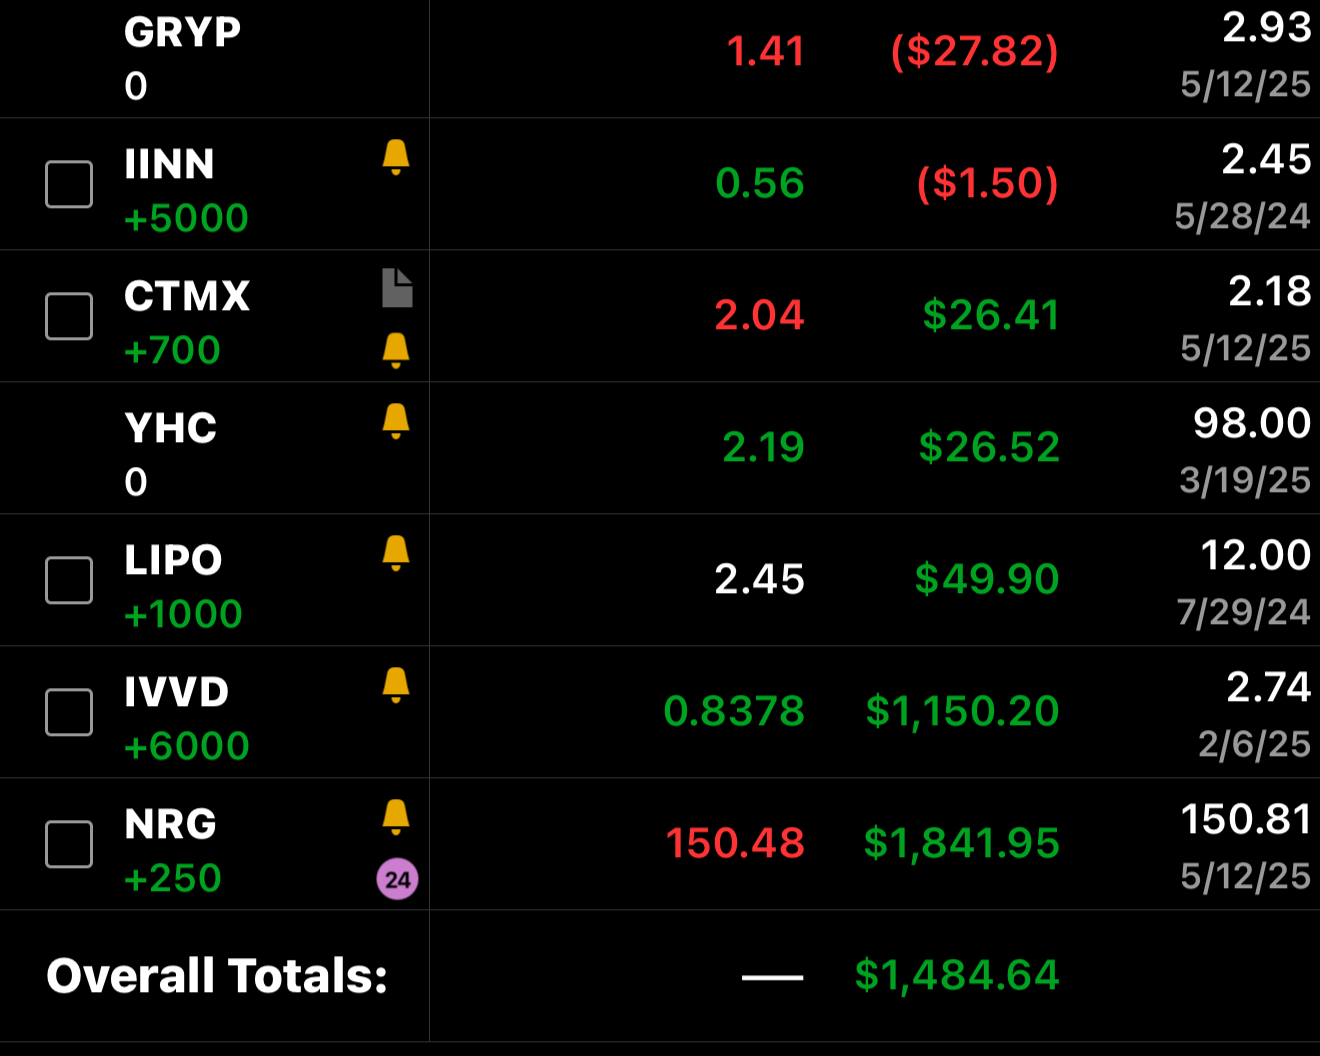
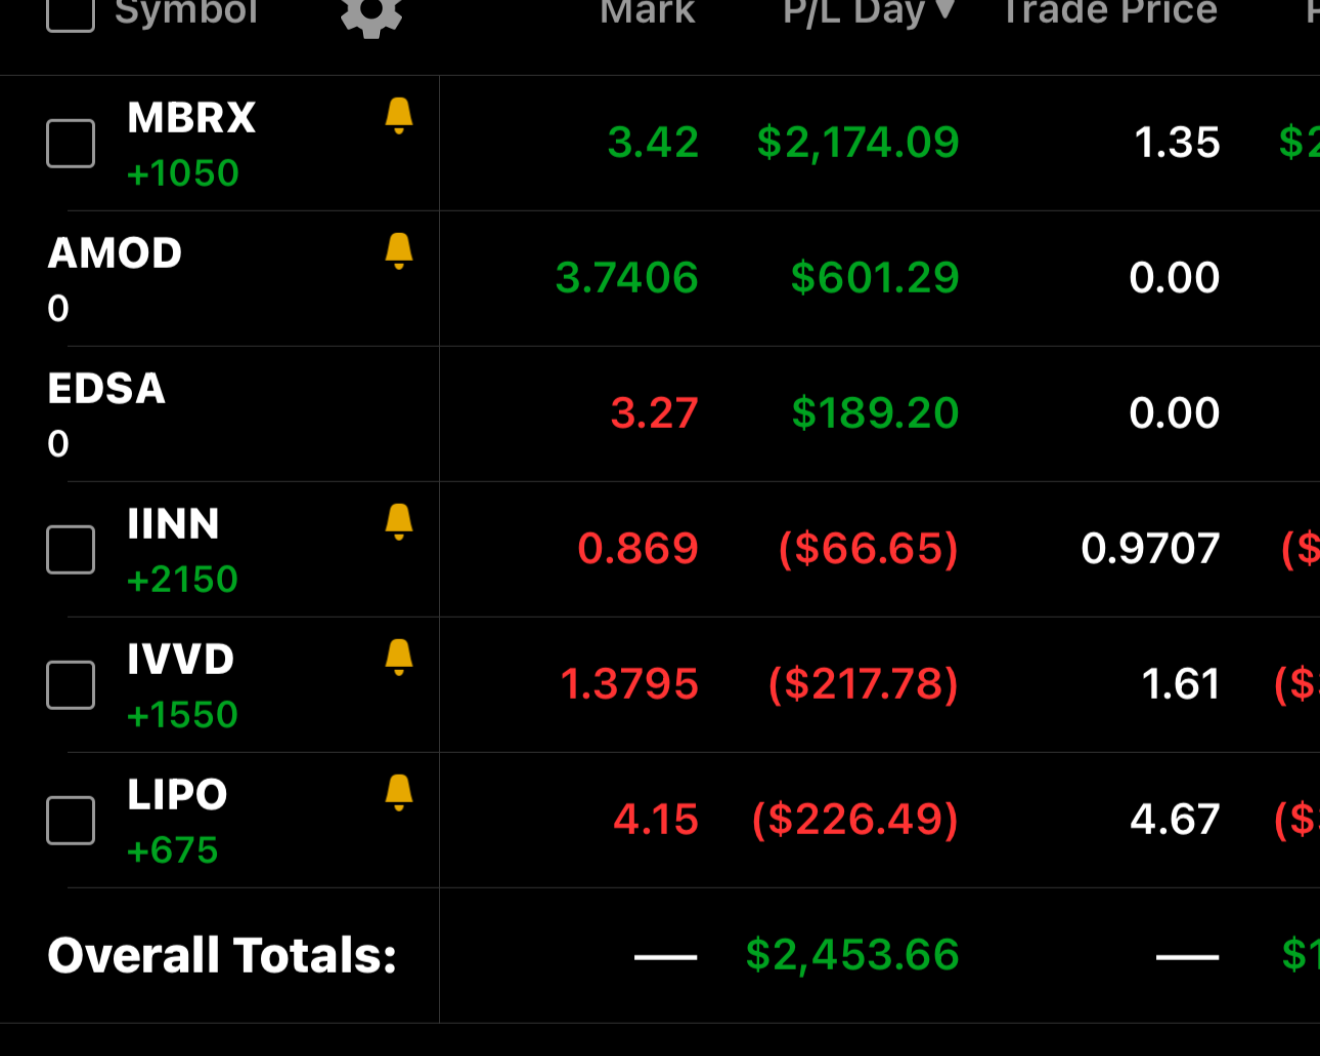
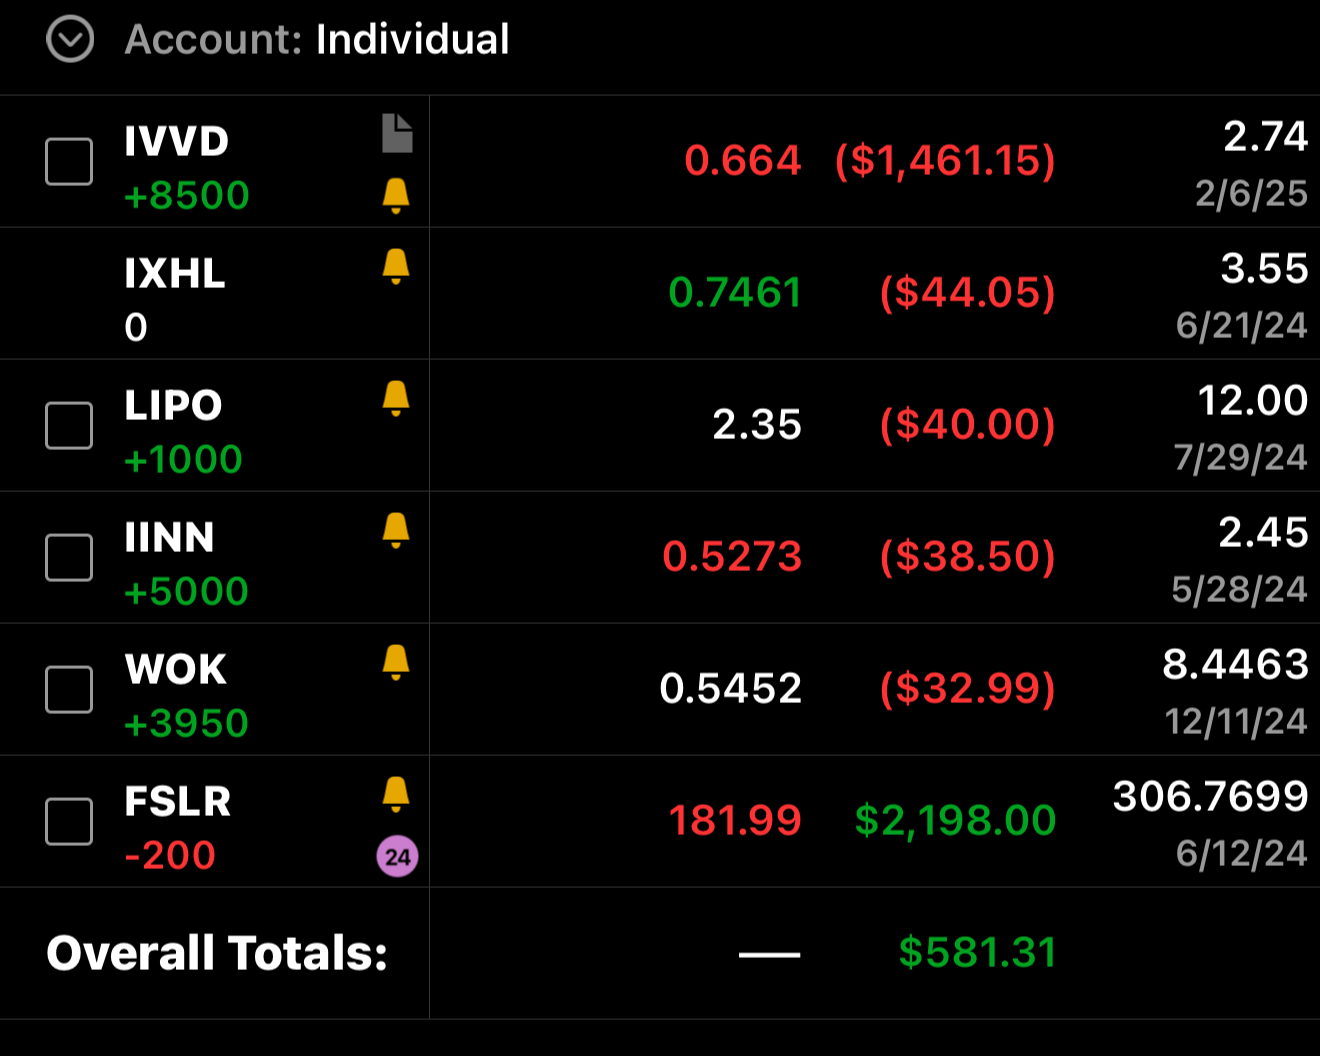
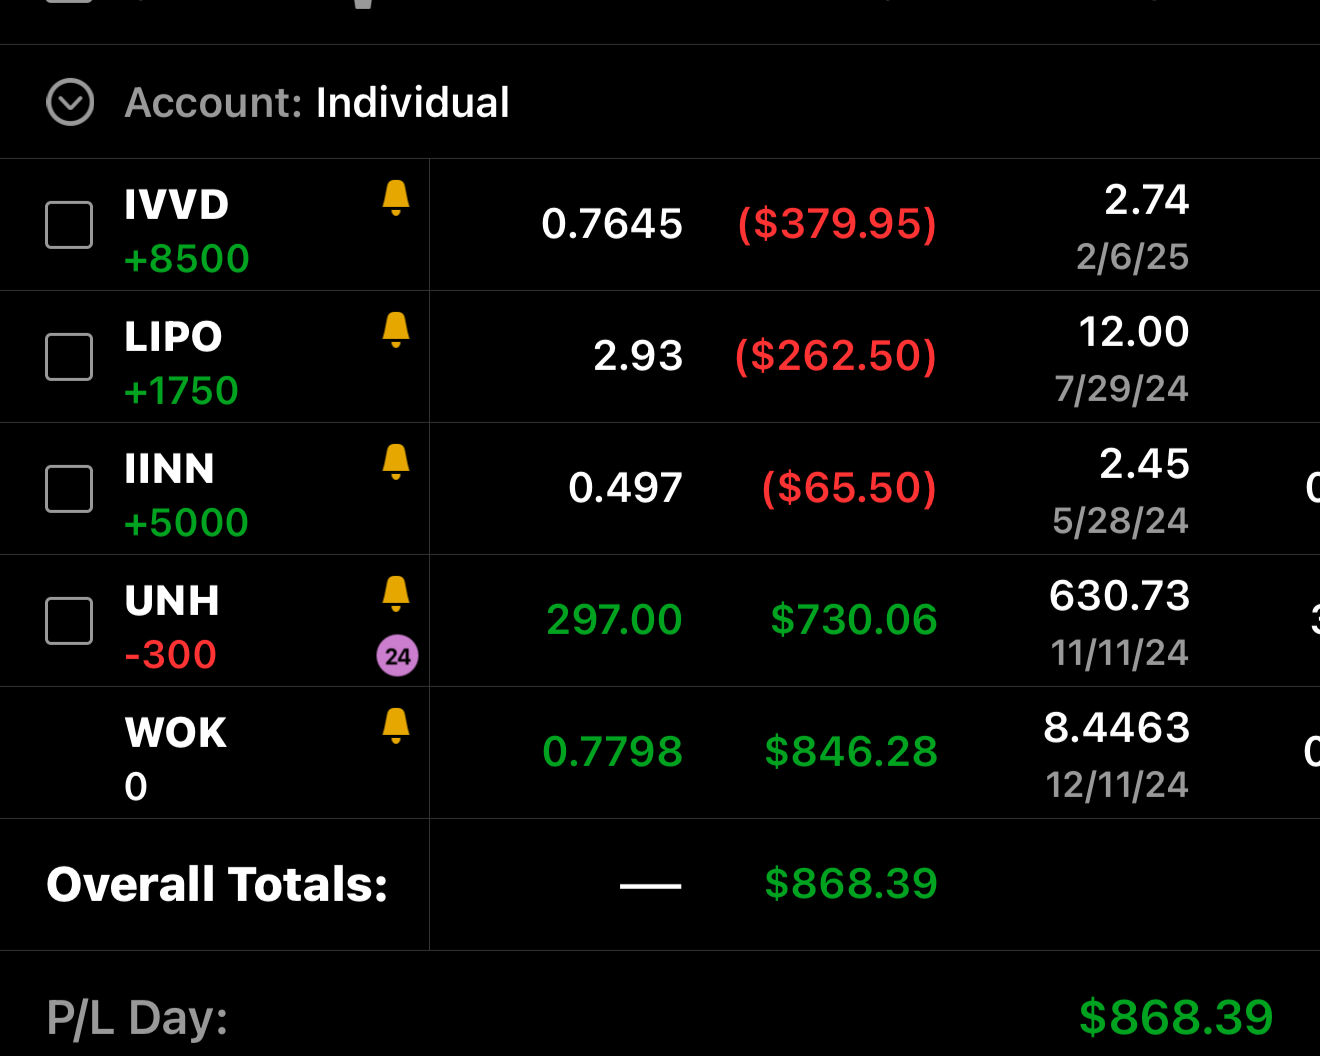
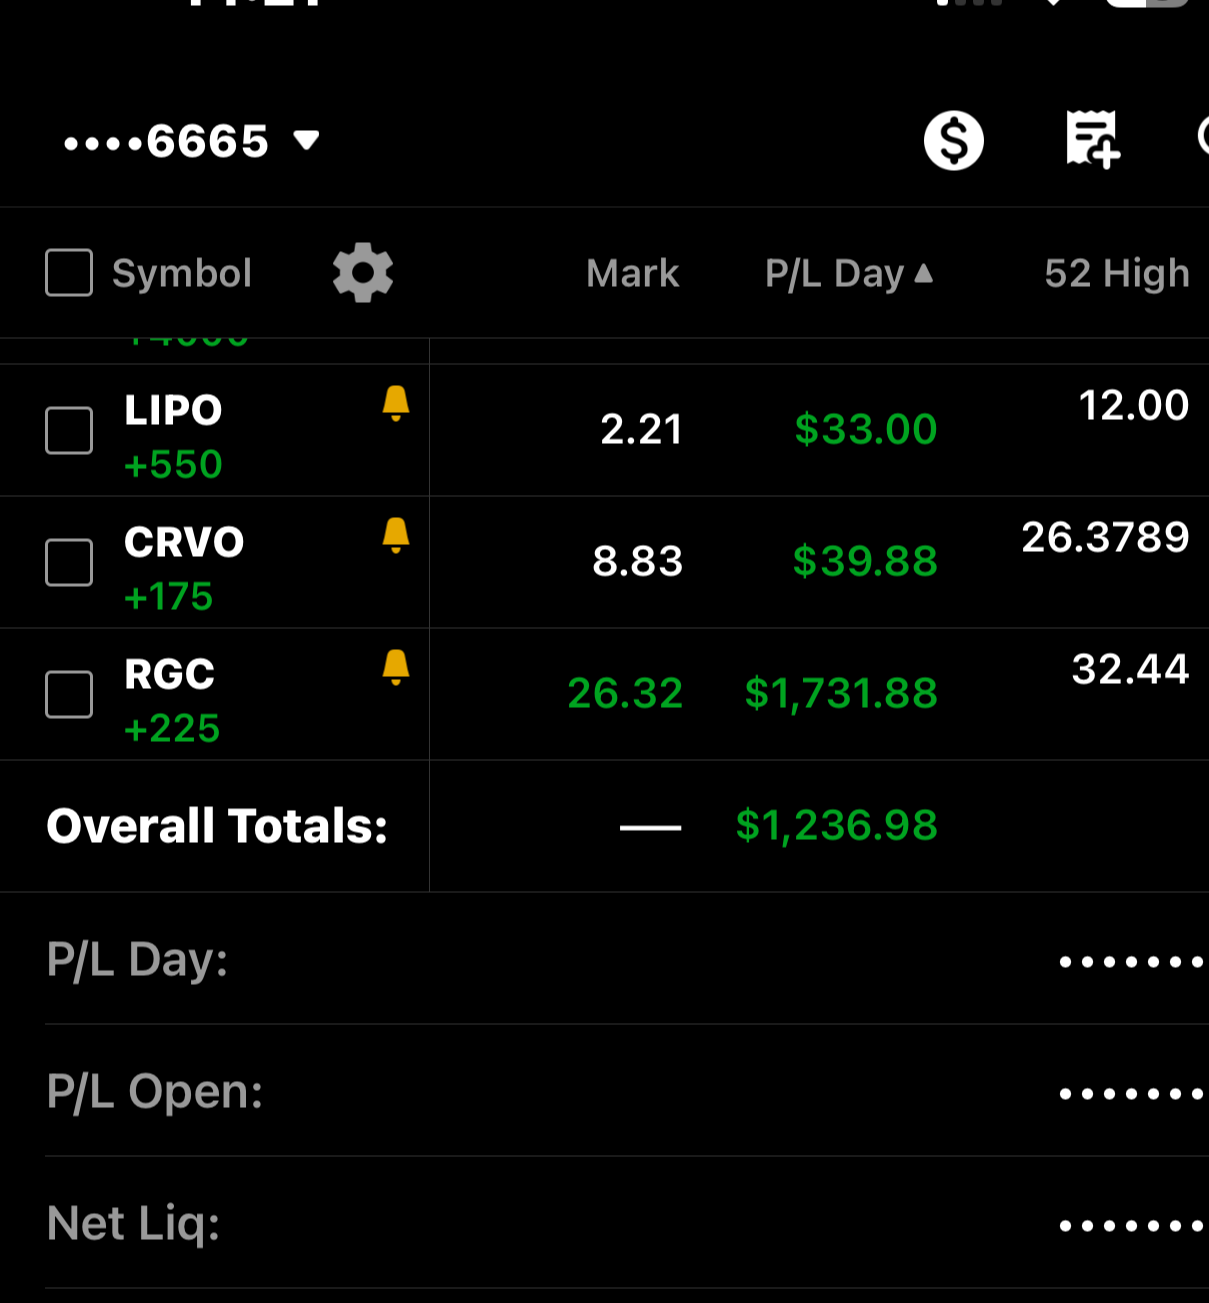
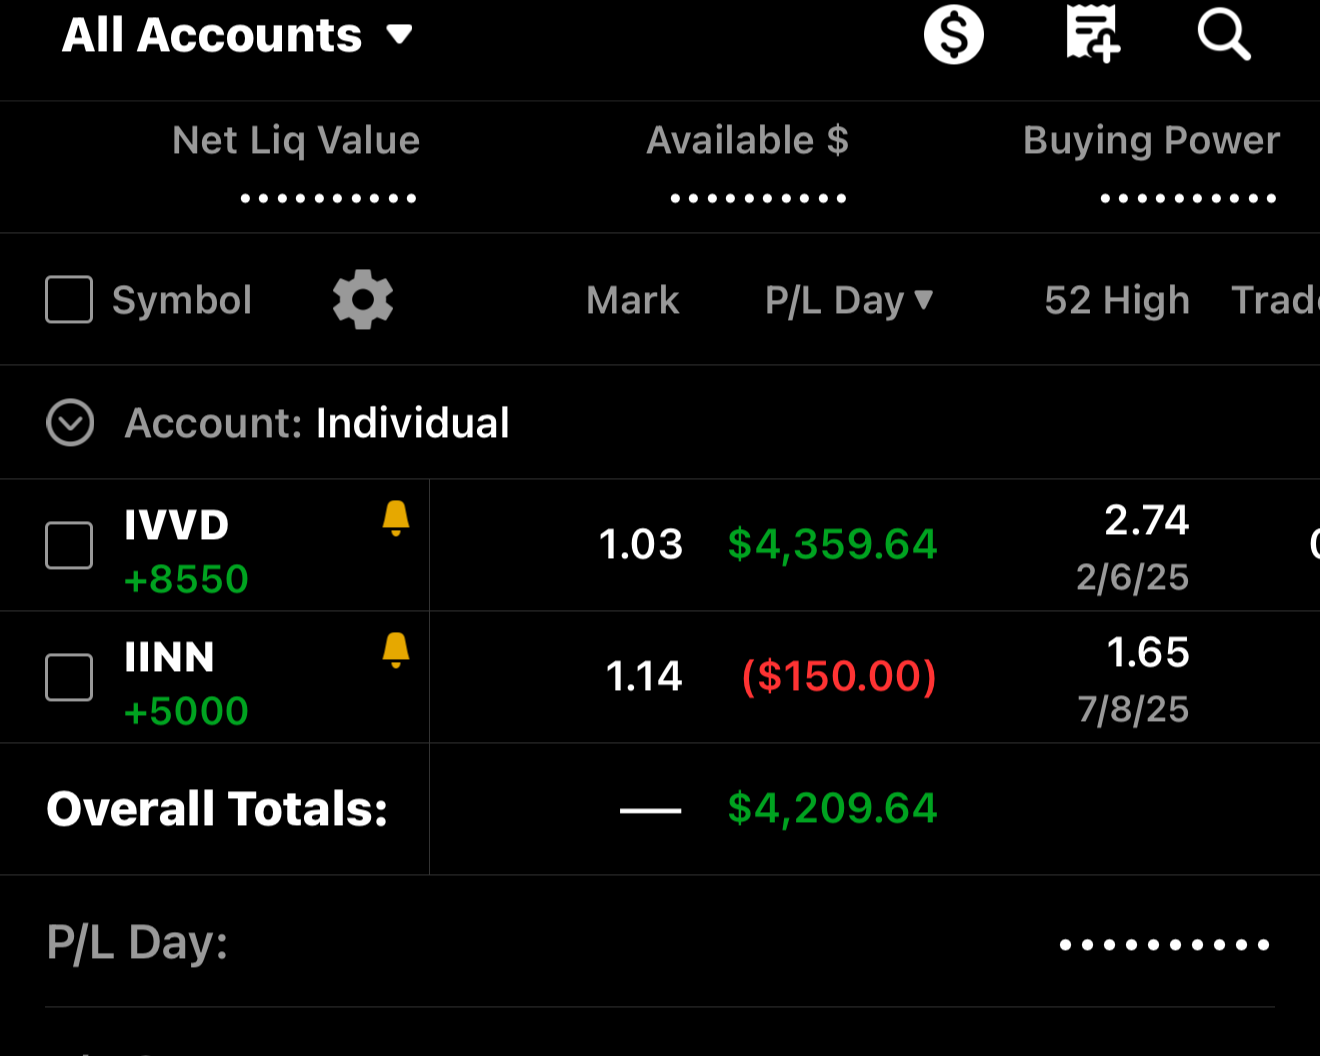
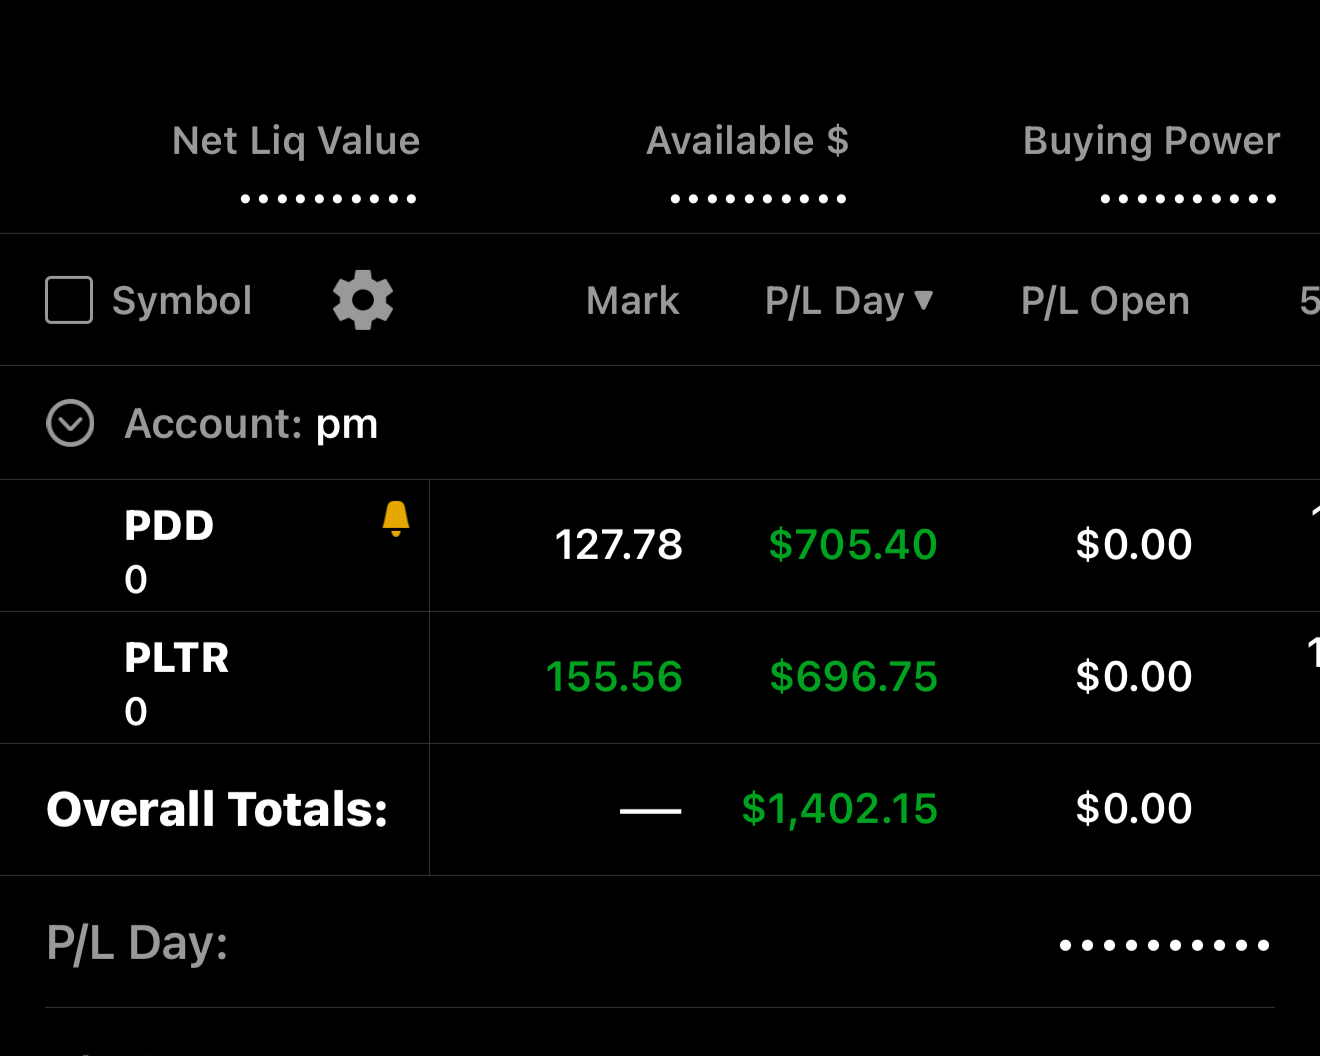
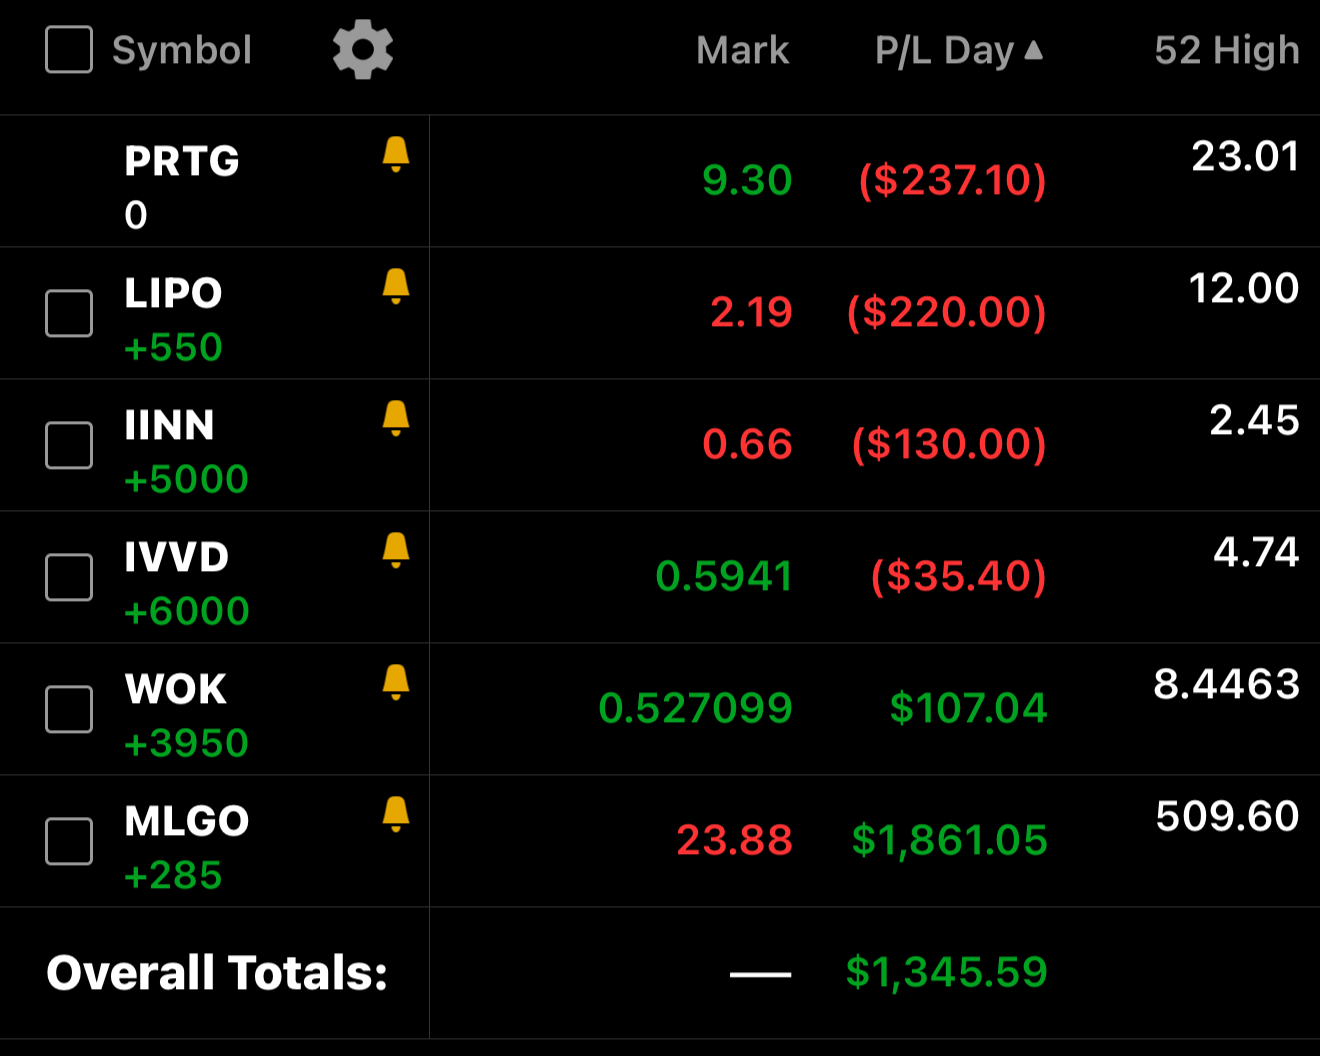
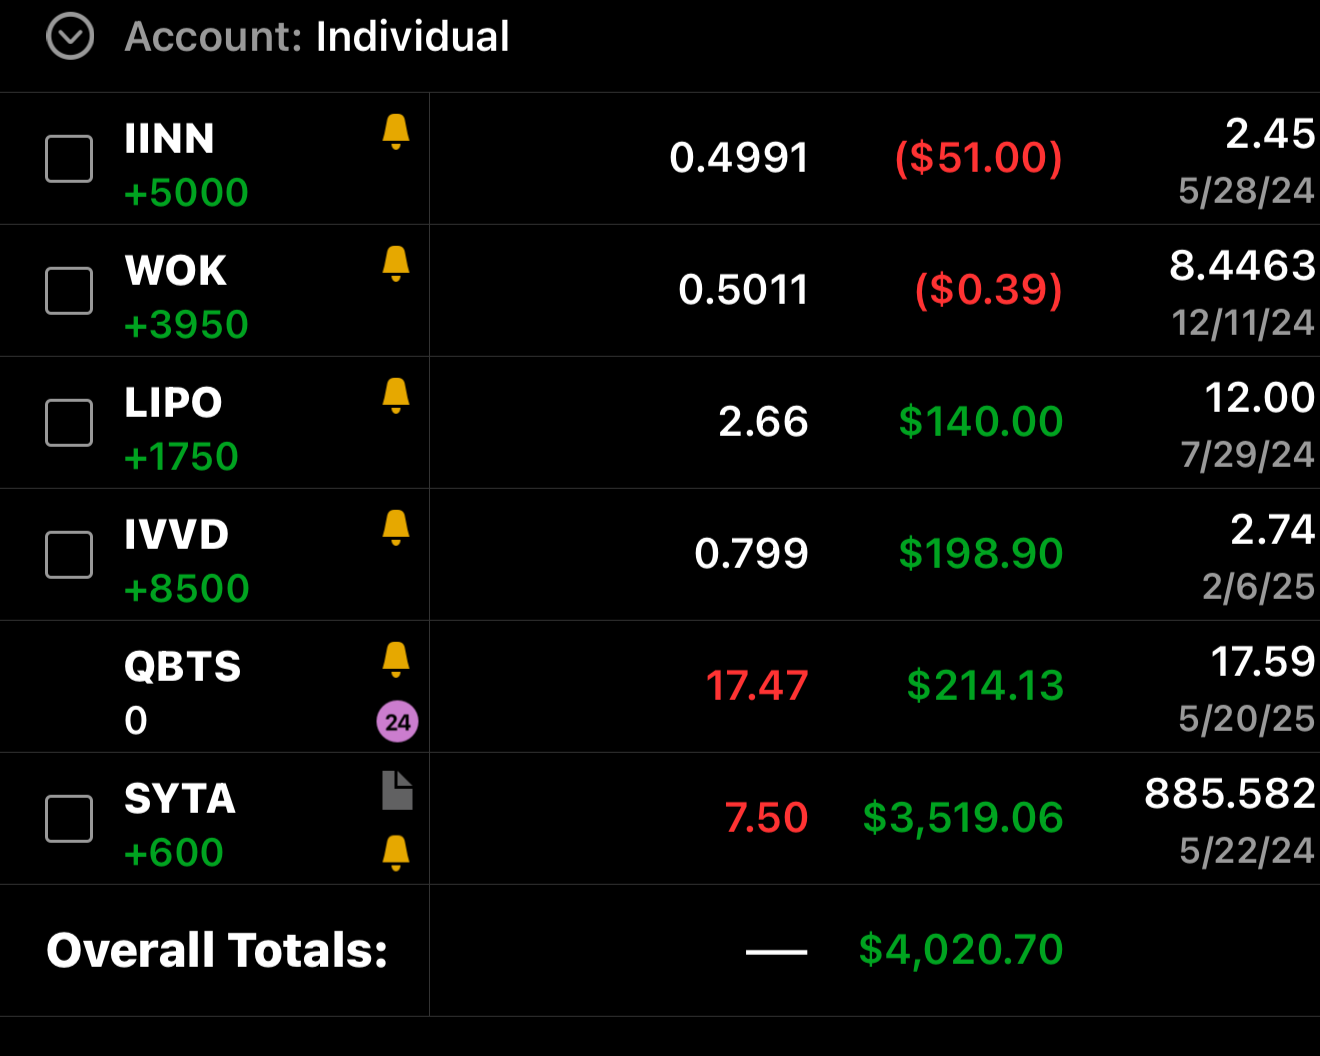
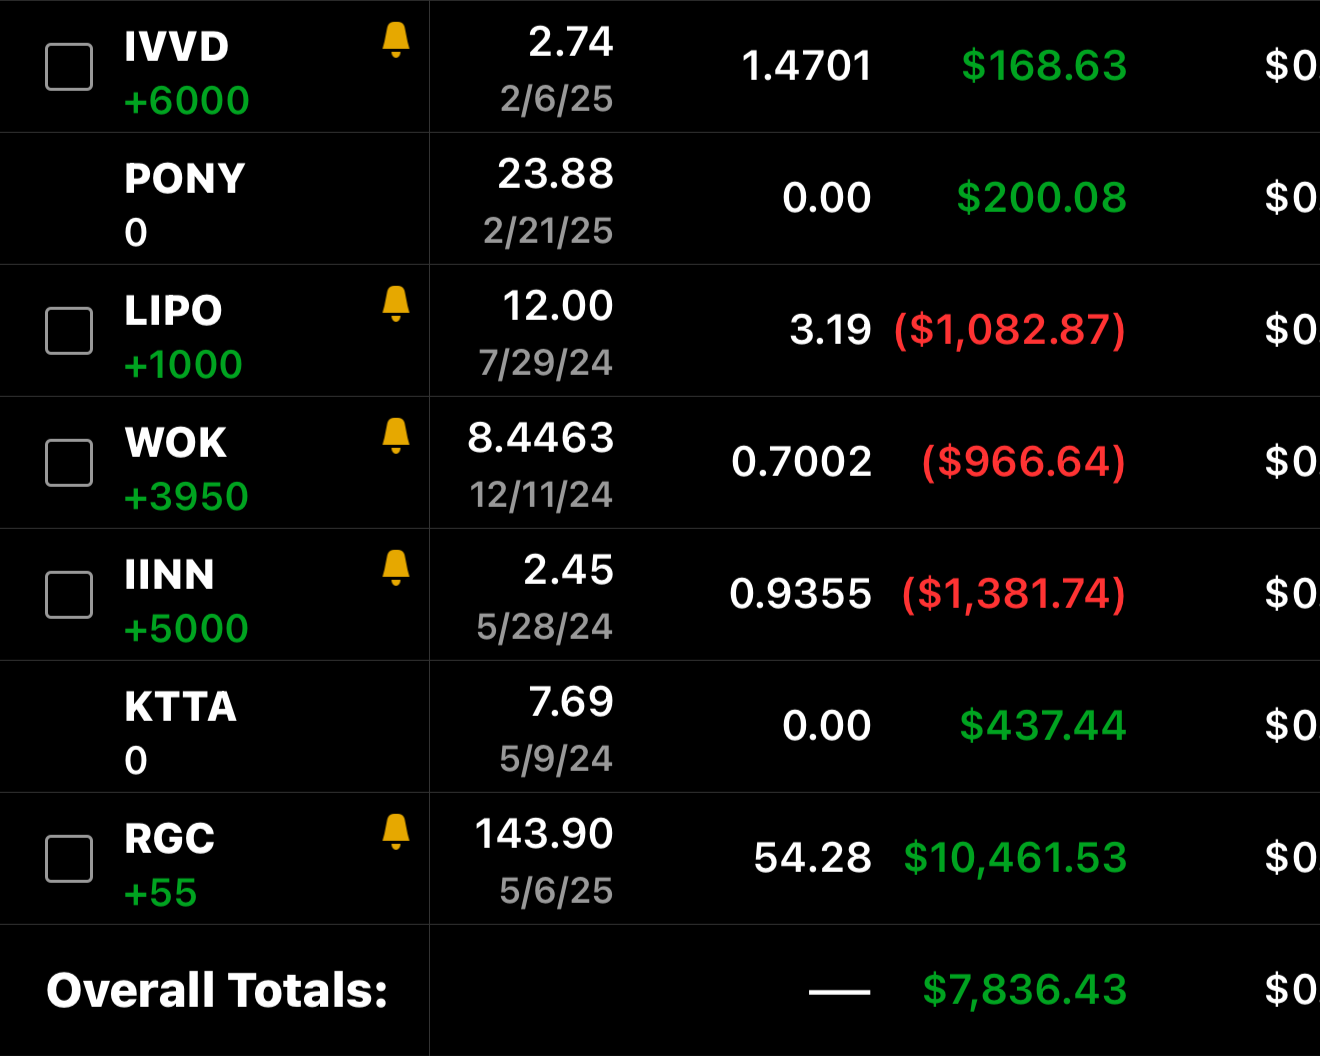
My portfolio
Here’s a glimpse of my portfolio, a collection of over 30 screenshots that show both my gains and my losses. As you’ll see, the majority of my trades are gains, but every single day I still encounter losses. That’s the reality of trading. The point isn’t to try and have zero losses, that’s impossible but to focus on making sure your winners are bigger and more consistent than your losers. This page is meant to be fully transparent, so you can see exactly how I trade, manage risk, and grow over time.