

Technical Analysis
Introduction to Technical Analysis:
Technical analysis is a method of analyzing stocks by examining their historical price and volume data. It is based on the idea that past price movements can help predict future price movements. Technical analysis is used by traders and investors to make informed decisions about buying and selling stocks.
Why Use Technical Analysis:
Technical analysis is a useful tool for understanding stocks and making informed investment decisions. By understanding the underlying forces that drive a stock's price movement, you can make more informed trading decisions. Technical analysis can help you identify trends and potential reversals, determine support and resistance levels, identify potential entry and exit points, and confirm fundamental analysis.
Basic Principles of Technical Analysis:
There are four basic principles of technical analysis:
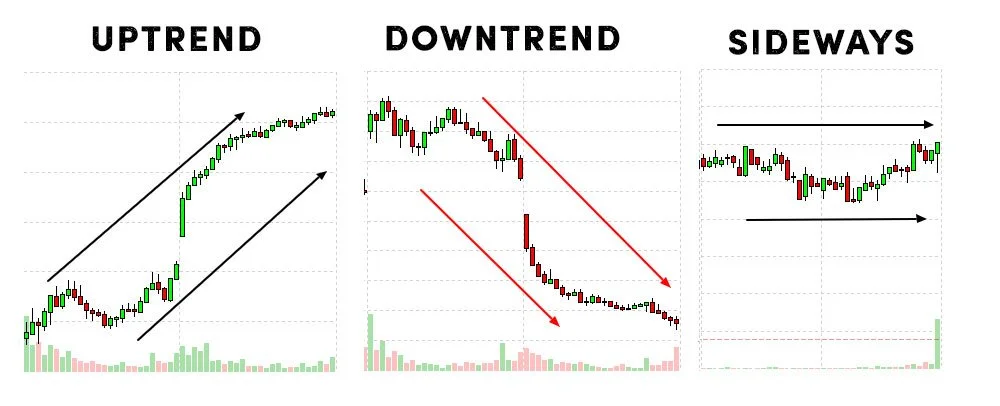
Trend Analysis: This is the general direction in which a stock's price is moving. Trends can be upward (bullish), downward (bearish), or sideways (range-bound). Trend analysis is used to identify the overall trend of a stock and to determine potential entry and exit points.
2. Support and Resistance Levels: Support refers to a price level at which a stock or other asset has historically tended to stop falling and begin to rise again. Resistance, on the other hand, is a price level at which a stock or other asset has historically tended to stop rising and begin to fall again. Traders believe that there is significant supply of the asset at this level, which creates a ceiling above its price. If the price of the asset rises towards the resistance level, traders may perceive it as a selling opportunity and enter into short positions, which can drive the price back down.
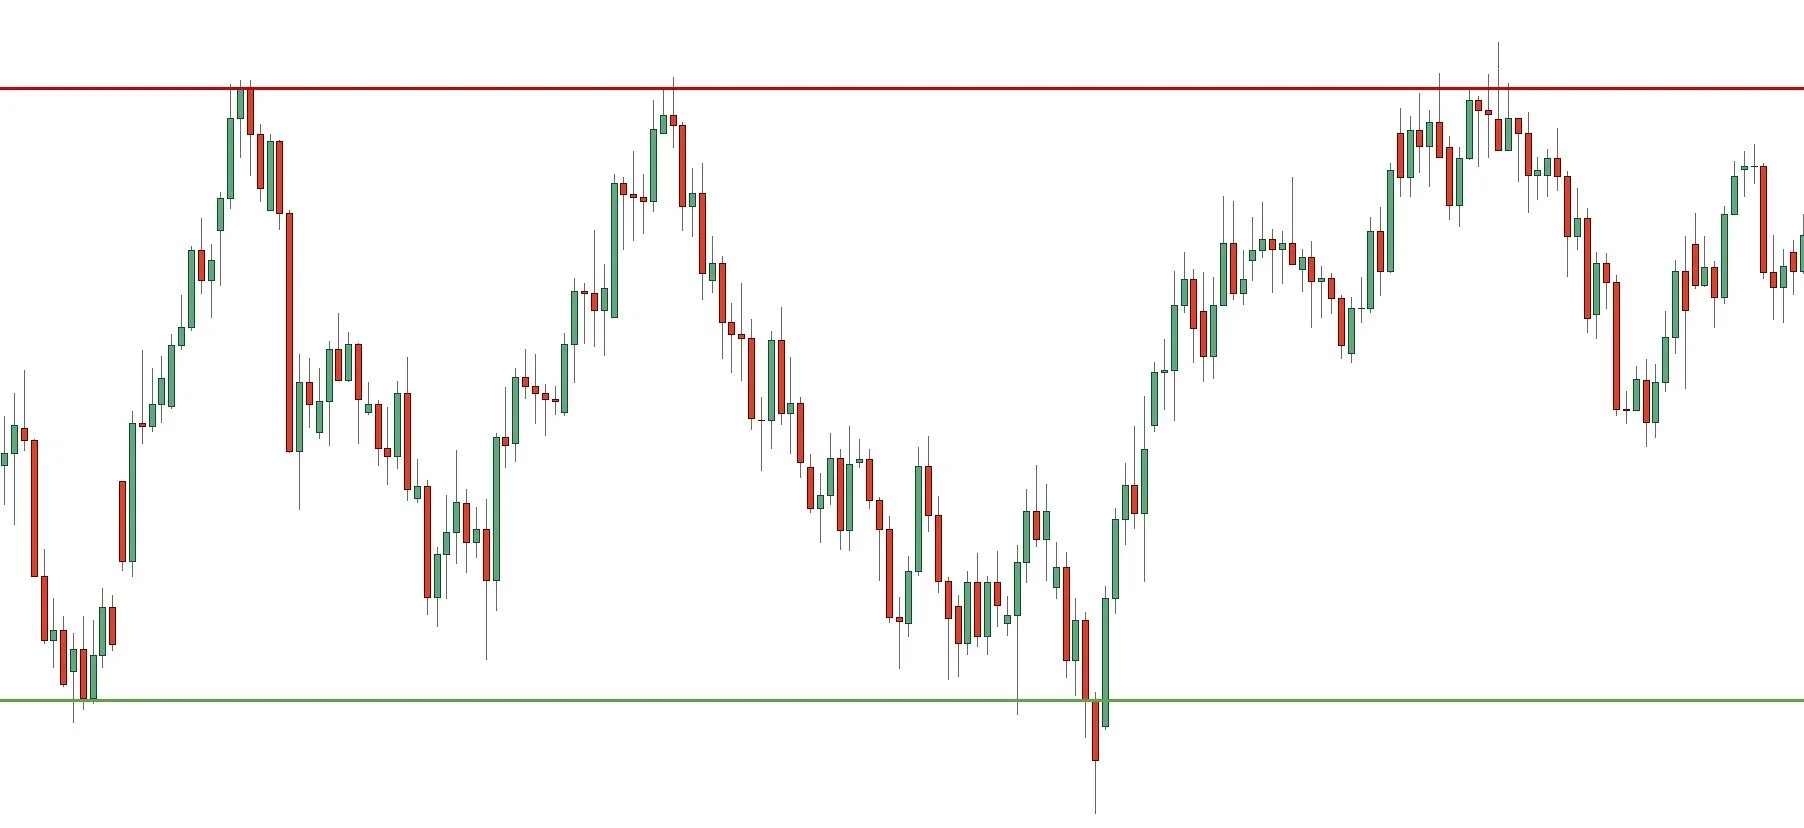
Resistance
Support
3. Chart Patterns: These are recurring patterns in a stock's price and volume data. Chart patterns can help identify potential entry and exit points, as well as confirm the direction of the trend.
There are several different types of chart patterns, some of which:

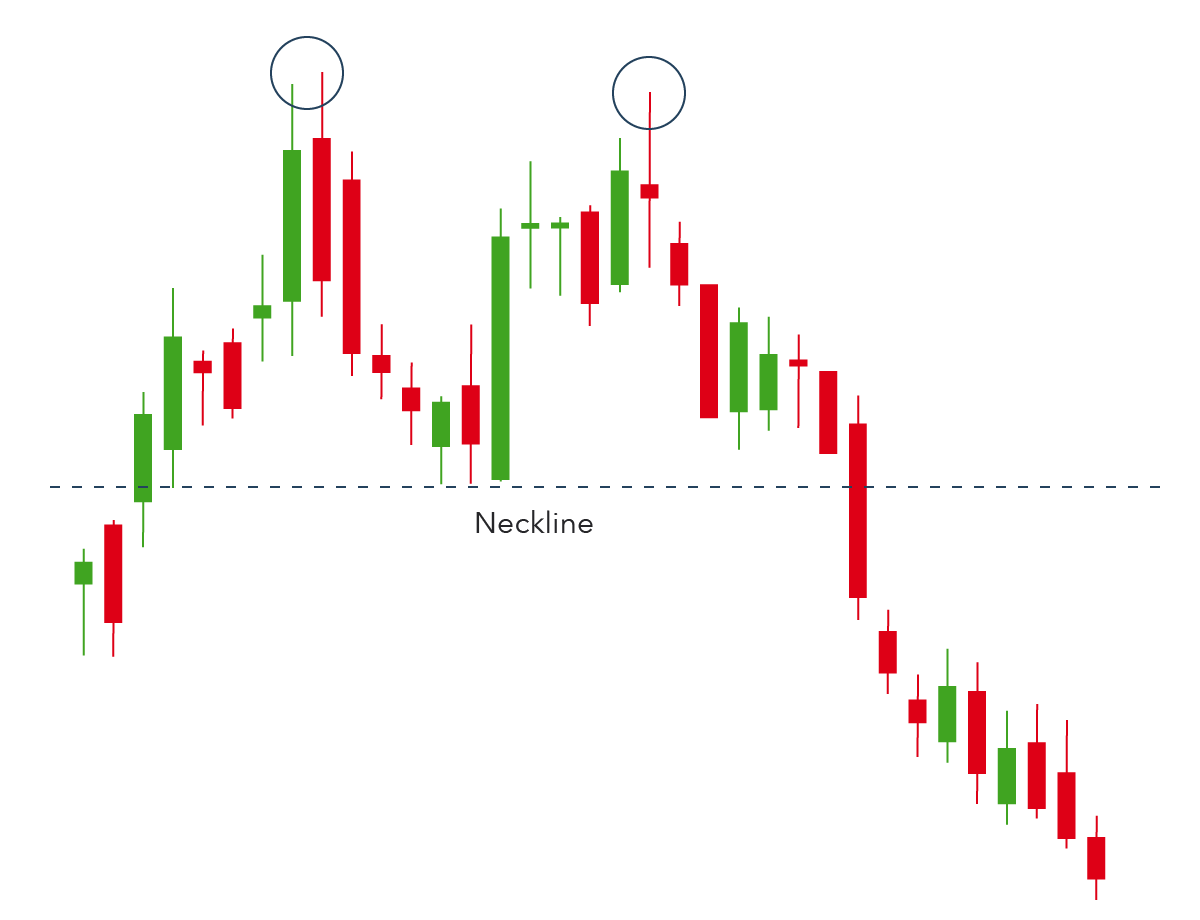
Head and Shoulders: This is a pattern that looks like a peak (the head) flanked by two smaller peaks (the shoulders). It is a bearish pattern, indicating that the stock may be about to reverse its upward trend and begin a downward trend.Double Top and Double Bottom: These are patterns that form when a stock's price reaches a certain level (the top or bottom) twice before reversing direction. A double top is a bearish pattern, indicating that the stock may be about to reverse its upward trend and begin a downward trend. A double bottom is a bullish pattern, indicating that the stock may be about to reverse its downward trend and begin an upward trend.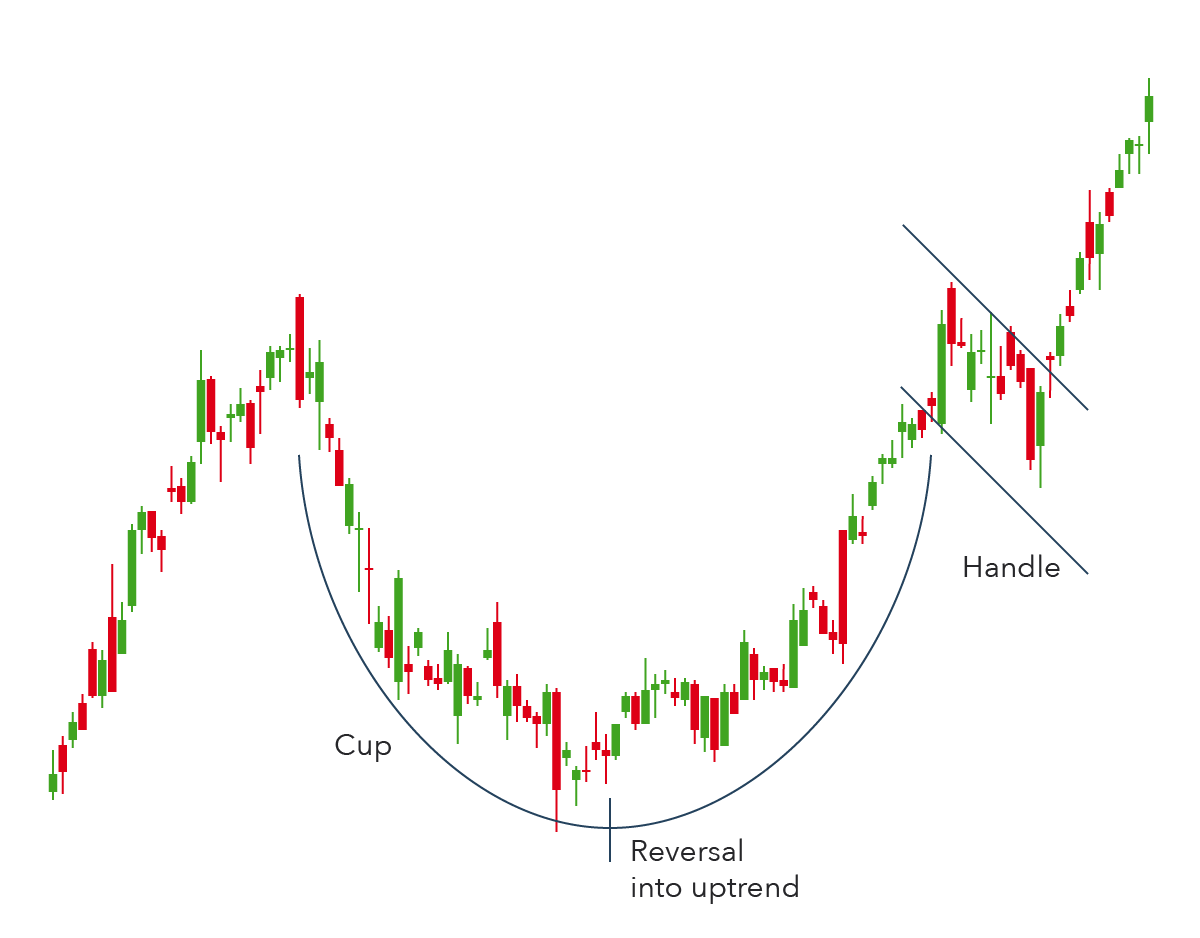
Cup and Handle: This is a bullish pattern that looks like a cup followed by a handle. The cup is formed when the stock's price reaches a high, then drops and levels out, forming a rounded bottom. The handle is formed when the stock's price rises slightly, then drops again before breaking out of the pattern and continuing to rise.There are many different types of indicators, but some of the most commonly used ones include:Moving Averages: These are lines that show the average price of a stock over a specified time period. They can help traders and investors identify the direction of the trend and potential support and resistance levels.Relative Strength Index (RSI): This is an oscillator that measures the magnitude of recent price changes to determine whether a stock is overbought or oversold. A reading above 70 indicates that a stock is overbought, while a reading below 30 indicates that it is oversold.Bollinger Bands: These are lines that are plotted two standard deviations away from a stock's moving average. They can help traders and investors identify potential support and resistance levels and measure volatility.MACD (Moving Average Convergence Divergence): This is an indicator that uses two moving averages to identify changes in momentum. A crossover of the two lines can signal a change in the direction of the trend.
4. Technical Indicators: They are mathematical calculations based on a stock's price and/or volume data that can help traders and investors identify potential entry and exit points and confirm the direction of the trend.
PACKAGES FOR DAY TRADERS

BASIC
-
You can learn the fundamentals of day trading stocks, understand technical analysis and charting, and learn how to implement successful trading strategies.
-
With our morning watchlist service, you will receive an expertly curated list of stocks each morning before the market opens. Our team of experienced traders and analysts scour the market for the best trading opportunities, and provide you with a comprehensive list of stocks to watch.
-
We scour the markets to bring you the latest news and insights on stocks. you can stay on top of earnings reports, product launches, regulatory changes, and other market-moving events. Our content is delivered through our website and email newsletters making it easy for you to access the information you need, wherever you are.
-
we are always looking for ways to provide more value to our subscribers. we are constantly offering special discounts on both our standard and pro packages. Whether you are a new customer or an existing subscriber, you can take advantage of these special offers and save on your subscription fees.

STANDARD
-
In this package, we include all of the services that are in the basic package, as well as additional features such as personalized coaching, advanced market analysis tools, detailed strategy breakdowns and so much more.
-
An integrated education service that is specifically designed to help traders learn the skills and strategies needed to succeed in day trading stocks. Our education service includes detailed lessons on technical analysis, fundamental analysis, market psychology, risk management, and much more.
-
we offer a specialized service that provides market analysis for day trading stocks. We analyze the various factors that influence the prices of stocks in the market. It involves examining technical indicators, fundamental data, and market sentiment to identify trading opportunities and make informed decisions.
-
Our strategy breakdowns provide detailed analysis of various trading strategies and techniques, including technical analysis, fundamental analysis, and trend following. We break down each strategy into easy-to-understand steps, and provide examples of how to apply them to real-world trading scenarios. Our strategy breakdowns are included in both our standard and pro packages.
-
Our technical analysis is included in both our standard and pro packages, Our technical analysis includes advanced charting tools, indicators, and market data to help you identify trends, support and resistance levels and covers a wide range of technical indicators, including moving averages, oscillators, and trend lines.
-
we offer comprehensive fundamental analysis in our packages to help our customers gain a deeper understanding of companies, industries, and market trends. Our fundamental analysis includes in-depth research on companies' financial statements, earnings reports, industry trends, and market performance.

PROFESSIONAL
-
we understand that serious traders and investors require more than just basic market news and analysis to make informed investment decisions. That's why we offer a comprehensive Pro package that includes both our Basic and Standard packages, as well as additional features and tools designed to help you succeed in the stock market.
-
With our Pro package, you'll get all the benefits of our Basic and Standard packages. Gain access to our online education platform, which includes a range of courses, webinars, and tutorials covering topics such as technical analysis, risk management, trading psychology, and more.
-
you will receive our Daily News & Morning Watchlist delivered straight to you each morning. Our experienced team of analysts scours the markets to bring you a concise summary of the day's top news and developments, as well as a curated list of stocks to watch based on our research and analysis.
-
In-depth analysis of the stock market that covers a wide range of markets, including ETFs. We cover all stocks, including blue-chip companies, emerging market stocks, and small-cap stocks, to provide our clients with a comprehensive view of the market.
-
Our strategy breakdowns provide detailed analysis of various trading strategies and techniques, including technical analysis, fundamental analysis, and trend following. We break down each strategy into easy-to-understand steps, and provide examples of how to apply them to real-world trading scenarios. Our strategy breakdowns are included in both our standard and pro packages.
-
trading and investing in the stock market is as much about psychology as it is about numbers and data. Our Market & Behavioral Psychology feature combines insights from both market analysis and psychology to provide a comprehensive understanding of how emotions and human behavior can impact the stock market. We analyze investor sentiment, market trends, and other behavioral factors that can drive stock prices up or down.
-
Managing risk is a critical component of successful trading and investing in the stock market. We provide detailed risk analysis on individual stocks and market sectors, including volatility, historical performance, and other key risk factors that can impact a stock's performance. We also provide risk management strategies and techniques that traders and investors can use to mitigate their risk exposure, including diversification, position sizing, stop-loss orders, and other risk management tools.
-
We provide detailed technical analysis on individual stocks and market sectors, including price action, chart patterns, technical indicators, and other key technical factors that can impact a stock's performance. We also provide technical analysis strategies and techniques that traders and investors can use to identify potential entry and exit points, including trend analysis, support and resistance levels, and other technical signals. Our technical analysis feature is designed to help traders and investors develop a more comprehensive view of the market and make more informed trading decisions.
-
Our fundamental analysis feature includes a variety of tools and resources to help traders and investors analyze a company's financial health and identify potential trading opportunities. We provide detailed fundamental analysis on individual stocks and market sectors, including financial statements, earnings reports, valuations, and other key financial factors that can impact a stock's performance.